OPEN-SOURCE SCRIPT
Strong ORB Matrix | ProjectSyndicate
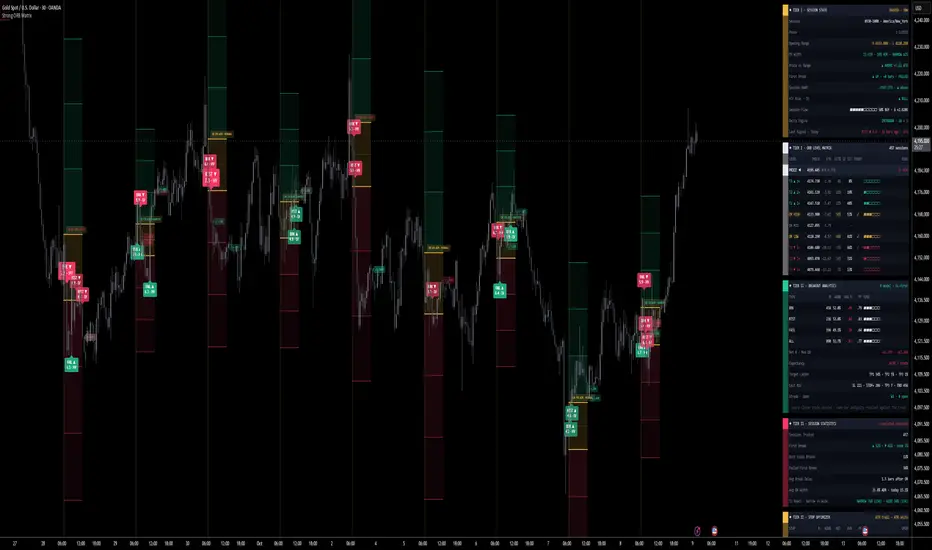
▪️Strong ORB Matrix takes the one level every intraday trader watches, the opening range, and tells you how it has actually behaved. The first minutes of a session carve out a high and a low that the rest of the day trades around. "Breakout above the opening range" on its own is a guess. Some sessions break and run. Others poke through and fail straight back inside. This indicator stops treating those the same. It measures every session, scores every breakout as it happens, and shows you the range's own track record before you commit.
▪️The opening range becomes a shaded box with three extension targets stacked above and below it. When price closes beyond an edge, the engine opens a trade, follows it to a resolved outcome, and logs it: a third banked at each target, stop to breakeven after the first, a trail on the runner. Those outcomes become each signal type's win rate, average R, profit factor and target-reach ladder. The range's color and the level labels come from real history: how often each target has been reached, and how often it was reached when the first break went that way.
▪️Most opening-range tools draw a box and a couple of lines and stop there. This one counts, across every session it can see, which way the first break went, whether it held or failed, how wide the range was, and whether each extension target actually gets reached. All of it is written onto the levels and laid out in a five-panel dashboard.
🎯 The Breakout Classifier (the core). The moment price closes beyond the range edge, the engine asks which of three things is happening:
BRK — a clean first close beyond the edge. The classic opening-range breakout.
RTST — price broke out, pulled back to the edge, and closed back in the break direction. The retest held.
FAIL — a break that closed back inside the range by a set depth within a set window. The move is faded toward the opposite side.
Wicks don't trigger anything. Only a confirmed close opens a signal.
⭐ Strength Score (0–10). Every setup is graded before it fires on seven inputs: volume surge versus its baseline, where the bar closes in its range, how far price displaced past the edge in ATR, how narrow or wide the opening range is against its own history, higher-timeframe trend alignment, aggressive buy/sell delta, and which side of session VWAP price sits on. Narrow ranges score breakouts higher, wide ranges score fades higher. A setup below the minimum score is filtered out; a high-conviction score is drawn larger. The weights are all adjustable.
📊 The Level Matrix That Shows Its Record. Six levels sit in the dashboard, three above price and three below, split by a live PRICE row. Each extension target reports its unconditional hit rate across all tracked sessions and, next to it, its conditional hit rate on sessions whose first break went that way, because a target reached after an upside break is a different claim from one reached after a downside break. The range edges report their close-break rates. A gauge and a distance-in-ATR column make the read instant.
🔬 The Intrabar Delta Engine. Rather than guessing buying and selling from the chart bar alone, the engine reads lower-timeframe bars inside each chart bar and sums their real order flow, falling back to a modelled estimate only when intrabars aren't available. That flow feeds the strength score, the session buy/sell pressure gauge, and a two-tone opening-range volume profile with its point of control and value area marked.
🧪 Honest Trade Model. Entry is at the signal bar's close, where you could actually act, not at the range edge price has already left. A third is taken at each of three targets, the stop moves to breakeven after the first, and the last third trails. Stop gaps fill at the open. When a target bar also trades back through the stop, the remainder is booked at the stop, not the target, so the numbers never flatter themselves. Every closed trade is counted. Losers keep their marker on the chart. The analytics panel reports win rate, average R, profit factor, net R, max drawdown, expectancy, the exit mix (full stop, breakeven, final target, window end) and the current streak.
🔧 The Stop Optimizer. On every first break of each session, five ATR trailing-stop widths run in parallel, measured in ATR units so different stop distances compare fairly. The panel ranks them by net result and stars the best, alongside the live trail drawn on the chart. It answers one question with your market's own data: how tight should the stop be?
📈 Session Statistics. Booked only when a session's window closes, so today's half-finished session never inflates the rates: how often the first break goes up versus down, how often both sides break (the two-way chop days), how often the first break fails, the average delay from range completion to first break, the average range width, and the first-target reach rate on narrow ranges versus wide ones.
🏛️ Level Hierarchy. The range high and low are the anchors. Three extension targets on each side are set by multiplier or by Fibonacci (0.382 / 0.618 / 1.0 of the range). A dotted midline marks the equilibrium. Every level carries its own history rather than being lumped together.
🎨 Shaded Zones with Live Levels. The opening range is a filled box; the breakout zones above and below fade outward through the three targets. The session itself is shaded while the range builds. An optional bar-color mode tints candles by where they sit relative to the range. Level labels carry plain-English hit rates with no hover-only text.
🔒 DST-Aware Sessions. The range is built in a named timezone that follows daylight saving automatically, so a 09:30 New York range stays at 09:30 through the whole year. Any bar that overlaps the range window counts, so the range forms correctly on every intraday timeframe, and overnight sessions that cross midnight are handled.
🔔 Native Alerts. Long signal, short signal, high-conviction signal, retest signal, failed-breakout signal, close above or below the range, opening range complete, and each of the four extension targets reached. Every alert names the level and the event and carries the entry, stop and targets.
🎯 Why this is different. An opening-range box treats every session the same. This one grades each breakout as it forms, keeps the first-break direction's record apart from the raw one, shows how often each target is actually reached, proves which stop width pays with your market's data, and counts every trade honestly so the win rate is one you could have lived through.
🚀 Built to adapt. The session, timezone, range source, extension type and all thresholds are inputs, so it fits the New York cash open, the London open, index futures, FX or crypto, on any intraday chart.
💡 Cleanest setup: run the chart at 5m–15m so the range resolves exactly, set the session and timezone to your market's open, and leave the classifier on all three types. Use a chart timeframe no longer than the range itself; the dashboard warns you when it isn't.
🎯 How To Trade It: Two Approaches
Everything comes down to one question: when price leaves this opening range, does it tend to run or snap back, and is the setup in front of you strong enough to lean on?
⚡ 1) Trade the Breakout: continuation out of the range
Use this on a BRK or RTST signal in the break direction.
▪️Read the record. You want a score of ★★★ or more, a narrow-range session (breakouts carry best out of compression), higher-timeframe trend on your side, volume surging on the break, and a healthy first-target hit rate for that side in the matrix.
▪️Trigger: the confirmed BRK close, or the RTST close after the pullback holds the edge.
Target: the three extension levels, scaled out a third at a time.
Stop: the range mid or opposite edge, as set in the trade model.
Invalidation: a close back inside that turns the setup into a FAIL. The break gave way, so stand aside or look to fade.
🧱 2) Fade the Failure: the break that snaps back
Use this on a FAIL signal.
▪️Read the record. You want a wide-range session (overextended ranges fail more), a high historical failed-break rate in the statistics panel, and price rejecting from beyond the edge back inside.
▪️Trigger: the confirmed FAIL close back inside the range.
Target: the range mid, then the opposite edge, then the first extension on the far side.
Stop: beyond the failed break's extreme.
Watch: a reclaim of the broken edge. If price pushes back out, the fade is done.
✋ Stand down: when the dashboard says wait
A score below your minimum, or a setup filtered out by the counter-HTF or session-cap guard.
A session that has already broken both sides: it's a two-way chop day.
Too few tracked sessions to trust the hit rates, or the first-target rates roughly equal on both sides.
A timeframe warning in the panel: the range isn't resolving cleanly.
Price sitting inside the range with no break in progress: wait for the close and let the alert bring you in.
Rule of thumb: ⚡ Narrow range + high score + HTF aligned + strong first-target rate → trade the breakout, scale out at the extensions. 🧱 Wide range + high failed-break history + rejection back inside → fade the failure toward the mid and opposite edge. ❄️ Low score, both sides broken, thin sample or a timeframe warning → stand down until the session has shown its hand.
▪️Honest statistics. This is a measurement and analysis tool, not a signal service and not a promise that any range will break or hold. Every trade is counted, none are dropped for losing, stops gap against you at the open, and session rates exclude the live session so nothing is flattered. The probabilities are the historical frequencies of this range on this market in the sessions the indicator can see. They describe how the opening range has behaved, not how it must behave next. Outcomes are recorded on confirmed closes and a live trade can still change until its bar closes.
▪️The opening range becomes a shaded box with three extension targets stacked above and below it. When price closes beyond an edge, the engine opens a trade, follows it to a resolved outcome, and logs it: a third banked at each target, stop to breakeven after the first, a trail on the runner. Those outcomes become each signal type's win rate, average R, profit factor and target-reach ladder. The range's color and the level labels come from real history: how often each target has been reached, and how often it was reached when the first break went that way.
▪️Most opening-range tools draw a box and a couple of lines and stop there. This one counts, across every session it can see, which way the first break went, whether it held or failed, how wide the range was, and whether each extension target actually gets reached. All of it is written onto the levels and laid out in a five-panel dashboard.
🎯 The Breakout Classifier (the core). The moment price closes beyond the range edge, the engine asks which of three things is happening:
BRK — a clean first close beyond the edge. The classic opening-range breakout.
RTST — price broke out, pulled back to the edge, and closed back in the break direction. The retest held.
FAIL — a break that closed back inside the range by a set depth within a set window. The move is faded toward the opposite side.
Wicks don't trigger anything. Only a confirmed close opens a signal.
⭐ Strength Score (0–10). Every setup is graded before it fires on seven inputs: volume surge versus its baseline, where the bar closes in its range, how far price displaced past the edge in ATR, how narrow or wide the opening range is against its own history, higher-timeframe trend alignment, aggressive buy/sell delta, and which side of session VWAP price sits on. Narrow ranges score breakouts higher, wide ranges score fades higher. A setup below the minimum score is filtered out; a high-conviction score is drawn larger. The weights are all adjustable.
📊 The Level Matrix That Shows Its Record. Six levels sit in the dashboard, three above price and three below, split by a live PRICE row. Each extension target reports its unconditional hit rate across all tracked sessions and, next to it, its conditional hit rate on sessions whose first break went that way, because a target reached after an upside break is a different claim from one reached after a downside break. The range edges report their close-break rates. A gauge and a distance-in-ATR column make the read instant.
🔬 The Intrabar Delta Engine. Rather than guessing buying and selling from the chart bar alone, the engine reads lower-timeframe bars inside each chart bar and sums their real order flow, falling back to a modelled estimate only when intrabars aren't available. That flow feeds the strength score, the session buy/sell pressure gauge, and a two-tone opening-range volume profile with its point of control and value area marked.
🧪 Honest Trade Model. Entry is at the signal bar's close, where you could actually act, not at the range edge price has already left. A third is taken at each of three targets, the stop moves to breakeven after the first, and the last third trails. Stop gaps fill at the open. When a target bar also trades back through the stop, the remainder is booked at the stop, not the target, so the numbers never flatter themselves. Every closed trade is counted. Losers keep their marker on the chart. The analytics panel reports win rate, average R, profit factor, net R, max drawdown, expectancy, the exit mix (full stop, breakeven, final target, window end) and the current streak.
🔧 The Stop Optimizer. On every first break of each session, five ATR trailing-stop widths run in parallel, measured in ATR units so different stop distances compare fairly. The panel ranks them by net result and stars the best, alongside the live trail drawn on the chart. It answers one question with your market's own data: how tight should the stop be?
📈 Session Statistics. Booked only when a session's window closes, so today's half-finished session never inflates the rates: how often the first break goes up versus down, how often both sides break (the two-way chop days), how often the first break fails, the average delay from range completion to first break, the average range width, and the first-target reach rate on narrow ranges versus wide ones.
🏛️ Level Hierarchy. The range high and low are the anchors. Three extension targets on each side are set by multiplier or by Fibonacci (0.382 / 0.618 / 1.0 of the range). A dotted midline marks the equilibrium. Every level carries its own history rather than being lumped together.
🎨 Shaded Zones with Live Levels. The opening range is a filled box; the breakout zones above and below fade outward through the three targets. The session itself is shaded while the range builds. An optional bar-color mode tints candles by where they sit relative to the range. Level labels carry plain-English hit rates with no hover-only text.
🔒 DST-Aware Sessions. The range is built in a named timezone that follows daylight saving automatically, so a 09:30 New York range stays at 09:30 through the whole year. Any bar that overlaps the range window counts, so the range forms correctly on every intraday timeframe, and overnight sessions that cross midnight are handled.
🔔 Native Alerts. Long signal, short signal, high-conviction signal, retest signal, failed-breakout signal, close above or below the range, opening range complete, and each of the four extension targets reached. Every alert names the level and the event and carries the entry, stop and targets.
🎯 Why this is different. An opening-range box treats every session the same. This one grades each breakout as it forms, keeps the first-break direction's record apart from the raw one, shows how often each target is actually reached, proves which stop width pays with your market's data, and counts every trade honestly so the win rate is one you could have lived through.
🚀 Built to adapt. The session, timezone, range source, extension type and all thresholds are inputs, so it fits the New York cash open, the London open, index futures, FX or crypto, on any intraday chart.
💡 Cleanest setup: run the chart at 5m–15m so the range resolves exactly, set the session and timezone to your market's open, and leave the classifier on all three types. Use a chart timeframe no longer than the range itself; the dashboard warns you when it isn't.
🎯 How To Trade It: Two Approaches
Everything comes down to one question: when price leaves this opening range, does it tend to run or snap back, and is the setup in front of you strong enough to lean on?
⚡ 1) Trade the Breakout: continuation out of the range
Use this on a BRK or RTST signal in the break direction.
▪️Read the record. You want a score of ★★★ or more, a narrow-range session (breakouts carry best out of compression), higher-timeframe trend on your side, volume surging on the break, and a healthy first-target hit rate for that side in the matrix.
▪️Trigger: the confirmed BRK close, or the RTST close after the pullback holds the edge.
Target: the three extension levels, scaled out a third at a time.
Stop: the range mid or opposite edge, as set in the trade model.
Invalidation: a close back inside that turns the setup into a FAIL. The break gave way, so stand aside or look to fade.
🧱 2) Fade the Failure: the break that snaps back
Use this on a FAIL signal.
▪️Read the record. You want a wide-range session (overextended ranges fail more), a high historical failed-break rate in the statistics panel, and price rejecting from beyond the edge back inside.
▪️Trigger: the confirmed FAIL close back inside the range.
Target: the range mid, then the opposite edge, then the first extension on the far side.
Stop: beyond the failed break's extreme.
Watch: a reclaim of the broken edge. If price pushes back out, the fade is done.
✋ Stand down: when the dashboard says wait
A score below your minimum, or a setup filtered out by the counter-HTF or session-cap guard.
A session that has already broken both sides: it's a two-way chop day.
Too few tracked sessions to trust the hit rates, or the first-target rates roughly equal on both sides.
A timeframe warning in the panel: the range isn't resolving cleanly.
Price sitting inside the range with no break in progress: wait for the close and let the alert bring you in.
Rule of thumb: ⚡ Narrow range + high score + HTF aligned + strong first-target rate → trade the breakout, scale out at the extensions. 🧱 Wide range + high failed-break history + rejection back inside → fade the failure toward the mid and opposite edge. ❄️ Low score, both sides broken, thin sample or a timeframe warning → stand down until the session has shown its hand.
▪️Honest statistics. This is a measurement and analysis tool, not a signal service and not a promise that any range will break or hold. Every trade is counted, none are dropped for losing, stops gap against you at the open, and session rates exclude the live session so nothing is flattered. The probabilities are the historical frequencies of this range on this market in the sessions the indicator can see. They describe how the opening range has behaved, not how it must behave next. Outcomes are recorded on confirmed closes and a live trade can still change until its bar closes.
Script de código abierto
Fiel al espíritu de TradingView, el creador de este script lo ha convertido en código abierto, para que los traders puedan revisar y verificar su funcionalidad. ¡Enhorabuena al autor! Aunque puede utilizarlo de forma gratuita, recuerde que cualquier republicación del código está sujeta a nuestras Normas internas.

Gold Algo Trading · +1100% YTD · max DD <5%
Syndicate Ultimate · 5 algo systems · 1 bundle
1 payment · lifetime access · no monthly fees
+ FX · NQ/ES · 10+ yr institutional desk
syndicate001.com
Join on Telegram
t.me/aisyndicate001
Syndicate Ultimate · 5 algo systems · 1 bundle
1 payment · lifetime access · no monthly fees
+ FX · NQ/ES · 10+ yr institutional desk
syndicate001.com
Join on Telegram
t.me/aisyndicate001
Exención de responsabilidad
La información y las publicaciones no constituyen, ni deben considerarse como, asesoramiento o recomendaciones financieras, de inversión, de trading u otro tipo, proporcionadas o respaldadas por TradingView. Obtenga más información en Condiciones de uso.
Script de código abierto
Fiel al espíritu de TradingView, el creador de este script lo ha convertido en código abierto, para que los traders puedan revisar y verificar su funcionalidad. ¡Enhorabuena al autor! Aunque puede utilizarlo de forma gratuita, recuerde que cualquier republicación del código está sujeta a nuestras Normas internas.
Gold Algo Trading · +1100% YTD · max DD <5%
Syndicate Ultimate · 5 algo systems · 1 bundle
1 payment · lifetime access · no monthly fees
+ FX · NQ/ES · 10+ yr institutional desk
syndicate001.com
Join on Telegram
t.me/aisyndicate001
Syndicate Ultimate · 5 algo systems · 1 bundle
1 payment · lifetime access · no monthly fees
+ FX · NQ/ES · 10+ yr institutional desk
syndicate001.com
Join on Telegram
t.me/aisyndicate001
Exención de responsabilidad
La información y las publicaciones no constituyen, ni deben considerarse como, asesoramiento o recomendaciones financieras, de inversión, de trading u otro tipo, proporcionadas o respaldadas por TradingView. Obtenga más información en Condiciones de uso.