Sadukey_trend_v8
Overview
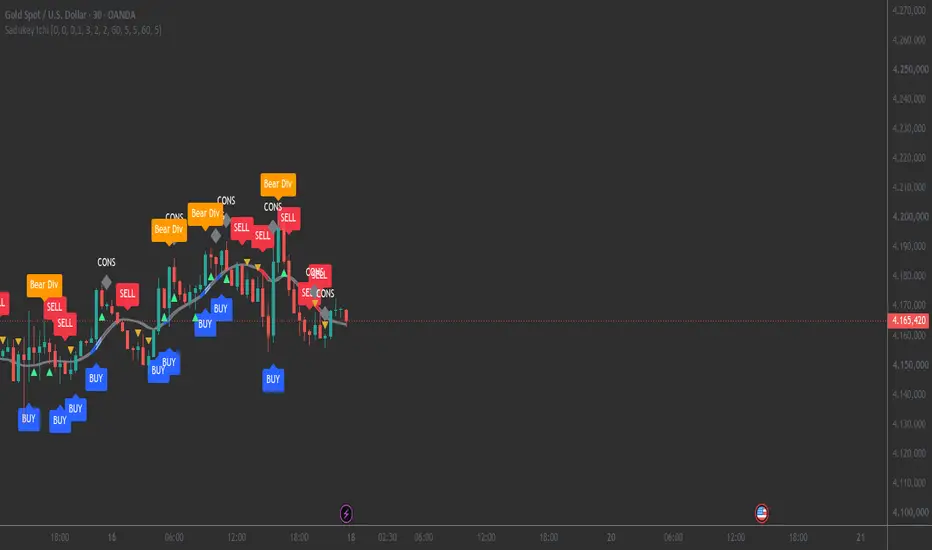
Sadukey Trend v8 is a cloud-style trend indicator, similar in look to an Ichimoku cloud. Two smoothed lines form a colored cloud that shows trend direction, strength and weakness at a glance. It also detects sideways phases (consolidations) and divergences.
Cloud colors
• Dark blue: strong uptrend (the distance is widening)
• Light blue: weak uptrend (the distance is shrinking)
• Red: strong downtrend
• Light red: weak downtrend
• Gray: consolidation / sideways phase
Consolidation detection
The gray zone is detected by three rules, each of which can be switched on or off:
1. Price inside the cloud: the closing price lies between the two lines.
2. Extremely thin cloud (squeeze): the line distance is smaller than an adjustable fraction of the ATR, so the rule adapts to any asset and timeframe.
3. Convergence early warning (new in v8): the cloud has been narrowing for several consecutive bars and is approaching the squeeze range. This flags a starting sideways phase earlier, instead of waiting until it is fully formed.
Signals
• BUY / SELL: on a line cross, or on a breakout from the gray consolidation zone
• CONS: a diamond above the candle when the market enters a consolidation
• Triangles (warnings): the trend is losing strength
• Bull Div / Bear Div: bullish and bearish divergence between price and the indicator All signals are generated after bar close.
Settings
• Consolidation: rules individually switchable, maximum cloud thickness as an ATR factor
• Early warning: number of narrowing bars and threshold multiplier (lower values react faster but are more prone to false signals)
• Display: colors, line thickness and fill transparency are fully adjustable
• Divergences: pivot bars left and right, minimum and maximum distance
• Visibility: signals and warnings can be shown or hidden separately
Alerts
Alert conditions are available for BUY, SELL and Consolidation. They trigger once per bar close.
Usage notes
• Divergence labels are confirmed only after the configured number of right-side pivot bars has passed, and are then drawn retroactively on the pivot bar. They are delayed and not meant for real-time entries.
• The indicator works on all timeframes and markets, but the default values should be adjusted per asset.
• In sideways markets, cross signals can occur more often. The gray zone helps to identify such phases.
Disclaimer
This indicator is for informational and educational purposes only and is not investment advice. Past performance does not guarantee future results. Trade at your own risk.
Sadukey Trend v8 is a cloud-style trend indicator, similar in look to an Ichimoku cloud. Two smoothed lines form a colored cloud that shows trend direction, strength and weakness at a glance. It also detects sideways phases (consolidations) and divergences.
Cloud colors
• Dark blue: strong uptrend (the distance is widening)
• Light blue: weak uptrend (the distance is shrinking)
• Red: strong downtrend
• Light red: weak downtrend
• Gray: consolidation / sideways phase
Consolidation detection
The gray zone is detected by three rules, each of which can be switched on or off:
1. Price inside the cloud: the closing price lies between the two lines.
2. Extremely thin cloud (squeeze): the line distance is smaller than an adjustable fraction of the ATR, so the rule adapts to any asset and timeframe.
3. Convergence early warning (new in v8): the cloud has been narrowing for several consecutive bars and is approaching the squeeze range. This flags a starting sideways phase earlier, instead of waiting until it is fully formed.
Signals
• BUY / SELL: on a line cross, or on a breakout from the gray consolidation zone
• CONS: a diamond above the candle when the market enters a consolidation
• Triangles (warnings): the trend is losing strength
• Bull Div / Bear Div: bullish and bearish divergence between price and the indicator All signals are generated after bar close.
Settings
• Consolidation: rules individually switchable, maximum cloud thickness as an ATR factor
• Early warning: number of narrowing bars and threshold multiplier (lower values react faster but are more prone to false signals)
• Display: colors, line thickness and fill transparency are fully adjustable
• Divergences: pivot bars left and right, minimum and maximum distance
• Visibility: signals and warnings can be shown or hidden separately
Alerts
Alert conditions are available for BUY, SELL and Consolidation. They trigger once per bar close.
Usage notes
• Divergence labels are confirmed only after the configured number of right-side pivot bars has passed, and are then drawn retroactively on the pivot bar. They are delayed and not meant for real-time entries.
• The indicator works on all timeframes and markets, but the default values should be adjusted per asset.
• In sideways markets, cross signals can occur more often. The gray zone helps to identify such phases.
Disclaimer
This indicator is for informational and educational purposes only and is not investment advice. Past performance does not guarantee future results. Trade at your own risk.

Exención de responsabilidad
La información y las publicaciones no constituyen, ni deben considerarse como, asesoramiento o recomendaciones financieras, de inversión, de trading u otro tipo, proporcionadas o respaldadas por TradingView. Obtenga más información en Condiciones de uso.
Exención de responsabilidad
La información y las publicaciones no constituyen, ni deben considerarse como, asesoramiento o recomendaciones financieras, de inversión, de trading u otro tipo, proporcionadas o respaldadas por TradingView. Obtenga más información en Condiciones de uso.