Position Sizer v2.1 - Risk & Trade Planning Tool
■ | OVERVIEW
Position Sizer v2.1 is an open-source risk-management and trade-planning tool designed to translate a predefined trading idea into a measurable and repeatable position-sizing process.
Instead of deciding position size subjectively, the tool starts from the amount of capital available, the percentage of capital the trader is willing to risk, the intended Entry and Stop Loss prices, and the estimated trading fees.
From these inputs, it calculates an executable position size designed so that the combined loss generated by:
remains aligned with the predefined risk budget.
The underlying concept is:
Pine Script®
The tool then determines how much of the selected instrument can be traded without intentionally exceeding that risk.
The indicator supports both:
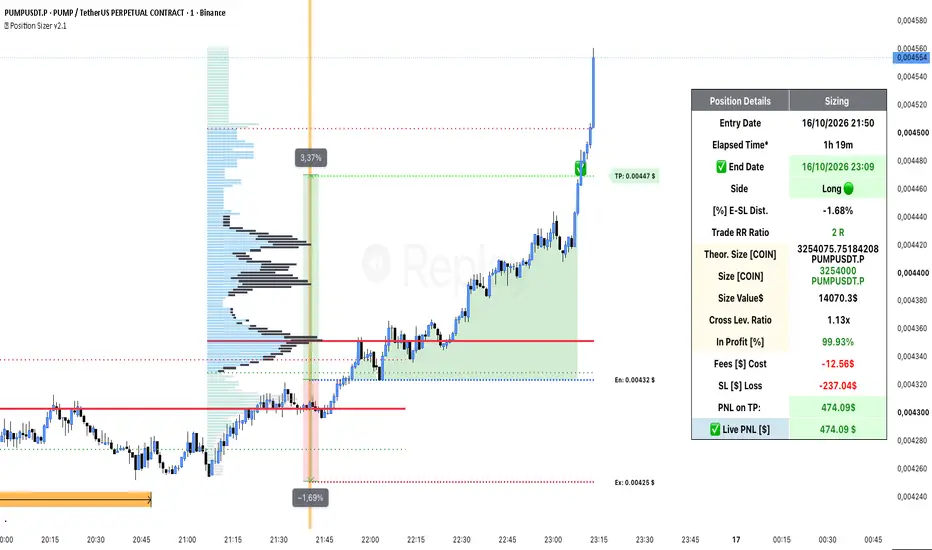
and provides a complete visual framework including Entry, Stop Loss, Take Profit, theoretical position size, executable position size, notional exposure, fees, expected loss, expected profit, trade duration and additional path-based analytics.

■ | 1. CORE WORKFLOW
The tool is designed around a simple sequence:
The indicator therefore works primarily as a pre-trade planning tool.
It does not generate market forecasts and does not automatically decide where Entry or Stop Loss should be placed. Those levels remain part of the user's trading methodology.
Once they are defined, the script answers a different question:
■ | 2. RISK-BASED POSITION SIZING
The first step is to calculate the monetary risk budget:
Pine Script®
For example:
Pine Script®
The position size is then derived from the distance between Entry and Stop Loss while also accounting for the configured transaction-cost model.
Long position
For a Long setup, the theoretical quantity is based on:
Pine Script®
Short position
For a Short setup:
Pine Script®
This means that the sizing engine does not consider only the raw distance between Entry and Stop Loss.
The configured fee affects the amount of exposure that can be taken.
■ | 3. THEORETICAL VS EXECUTABLE SIZE / CONT-TOLERANCE
A mathematically correct theoretical position size is not always executable on a real trading venue.
Different instruments can impose very different minimum quantity increments.
For example, one market may allow:
Pine Script®
while another contract may require quantities to be submitted only in multiples such as:
Pine Script®
The dashboard therefore distinguishes between two values:
The CONT-Tolerance input represents the minimum executable quantity step.
The theoretical quantity is always rounded DOWN:
Pine Script®
Example:
Pine Script®
This produces the following relationship:
Pine Script®
The script deliberately rounds downward rather than to the nearest available quantity.
Rounding upward could produce a position slightly larger than the predefined risk budget allows.

■ | 4. TAKE PROFIT ENGINE
Two Take Profit models are available.
Fixed RR
The user defines a Risk/Reward multiple.
For a Long position:
Pine Script®
For a Short position:
Pine Script®
Example:
Pine Script®
Fixed TP
The user can alternatively define the Take Profit price directly.
In this mode, the script calculates the resulting Risk/Reward ratio from the selected Entry, Stop Loss and Take Profit levels.
The indicator can therefore operate in both directions:
■ | 5. CHART VISUALIZATION
Position Sizer plots the three main trade levels directly on the chart:
Price labels are displayed alongside the active levels.
After the selected starting time, the script waits for price to actually intersect the Entry level.
The trade is considered entered when:
Pine Script®
Until this occurs, the position remains in its Pending state.
This prevents the monitoring and PNL engines from treating a trade as active before the configured Entry has actually been reached.
■ | 6. TRADE STATE ENGINE
The tool separates the simulated trade lifecycle into three explicit states:
Pending state
Before Entry is reached:
Pine Script®
No realized trade path exists yet, so Live PNL and exposure-time analytics are intentionally inactive.
Active state
Once Entry is reached:
Pine Script®
The script then starts monitoring price relative to Entry, TP and SL.
Closed state
When Take Profit is reached:
✅
When Stop Loss is reached:
❌
The End Date is fixed, elapsed time stops increasing, the trade path stops extending and the final PNL is frozen.
■ | 7. LIVE PNL AND CLOSED-TRADE FREEZE
Live PNL is inactive before Entry.
As long as the trade remains Pending, the dashboard displays:
Pine Script®
This prevents market movement occurring before the planned Entry from being incorrectly interpreted as position profit or loss.
Once the Entry level has actually been reached, the dashboard begins displaying a continuously updated Live PNL based on the current market price and the calculated executable position size.
When the trade reaches either TP or SL, Live PNL stops following subsequent market prices.
The final value is instead fixed to the modeled outcome associated with the trade:
The same state logic is applied to:

■ | 8. DYNAMIC PROFIT / LOSS AREA
While the trade is active, the area between Entry and the current Close is dynamically colored.
For Long positions:
For Short positions the logic is reversed.
No dynamic profit/loss fill is produced while the position is still Pending.
The fill begins only after Entry is reached and exists only while the trade remains active.
Once TP or SL is reached, the trade path is considered complete and the dynamic fill stops extending into future bars.
This makes the effective exposure period visually distinguishable from both pre-entry and post-exit price action.
■ | 9. IN PROFIT [%]
The In Profit [%] metric is a path-based analytical measure designed to describe how price behaved relative to Entry during the lifetime of the trade.
The metric begins accumulating only after Entry has actually been reached.
For every active bar, the script measures:
Pine Script®
The distance is accumulated separately depending on whether the Close is on the profitable or adverse side of Entry.
The resulting metric is:
Pine Script®
For a Long position:
The conditions are reversed for Short positions.
Important: this is not literally the percentage of bars or clock time spent in profit.
It is a distance-weighted path metric.
A candle that closes far above Entry therefore contributes more favorable weight than a candle that closes only marginally above Entry.
Before Entry:
Pine Script®
The metric stops updating when the position reaches TP or SL.
Its purpose is to provide an additional characteristic of the trade path that may later be compared with final payout, trade duration or other performance metrics.
■ | 10. POSITION DETAILS DASHBOARD
The central dashboard summarizes both the planned configuration and the realized lifecycle of the position.
Entry Date
Before Entry:
Pine Script®
After Entry, it displays the date and, on intraday timeframes, the time at which the Entry level was first reached.
Elapsed Time
Before Entry:
Pine Script®
Once the trade is active, it measures exposure time from the actual Entry event.
The counter stops when TP or SL closes the simulated position.
End Date
Displays:
Side
Displays the selected operating direction:
E-SL Distance [%]
Percentage distance between Entry and Stop Loss.
Trade RR Ratio
Risk/Reward ratio implied by the currently selected Entry, Stop Loss and Take Profit configuration.
Theor. Size [COIN]
Exact theoretical quantity generated by the position-sizing equation before execution constraints are applied.
Size [COIN]
Executable quantity after rounding the theoretical size downward according to CONT-Tolerance.
The relationship is:
Pine Script®
Size Value $
Notional value of the executable position:
Pine Script®
Cross Lev. Ratio
Ratio between notional exposure and configured account balance:
Pine Script®
For example:
Pine Script®
It is an exposure ratio, not a reconstruction of a broker's liquidation or margin engine.
In Profit [%]
Distance-weighted measure of the favorable versus adverse path traveled around Entry while the position was active.
Fees [$] Cost
Estimated transaction-cost component used by the sizing model.
SL [$] Loss
Price-movement loss associated with reaching the configured Stop Loss.
The sizing calculation combines this component with modeled transaction costs when determining the theoretical maximum position size.
Because the final executable size is rounded downward, realized modeled risk may be marginally lower than the original mathematical risk budget.
PNL on TP
Expected PNL at the selected Take Profit level based on the executable position size.
Live PNL [$]
Displays:

■ | 11. TIME AND TIME ZONE MANAGEMENT
The From input defines when the tool begins monitoring the configured trade.
The script also provides a selectable time zone for displaying Entry Date and End Date.
Available options include several major market time zones, UTC and the symbol's exchange time zone.
The default is:
Pine Script®
This timezone automatically follows the corresponding daylight-saving rules.
On intraday charts, timestamps include hours and minutes.
On higher timeframes, the dashboard displays the calendar date.
■ | 12. LONG AND SHORT SYMMETRY
The tool is designed for both directional cases.
For Long positions:
Pine Script®
For Short positions:
Pine Script®
The position-sizing formulas, PNL calculations, favorable/adverse path logic and TP engine adapt to the selected Side.
■ | 13. PRACTICAL WORKFLOW
A practical use of the tool can follow this sequence:
This workflow deliberately places risk before position size.
Instead of starting from:
the tool starts from:
Position size becomes the result of that decision rather than the starting point.
■ | 14. WHY THIS TOOL IS DIFFERENT
Position Sizer combines several functions into a single trade-planning environment:
The purpose of combining these elements is not to increase trade frequency or generate signals.
It is to make a manually planned trade measurable before execution and analyzable after the event.
■ | 15. EXECUTION ASSUMPTIONS
The indicator simulates the lifecycle of the manually configured trade using chart OHLC data.
There are several important assumptions to understand.
Entry detection
An Entry is considered reached when the bar's range contains the selected Entry price:
Pine Script®
Until that condition occurs, the simulated trade remains Pending and Live PNL stays inactive.
Intrabar sequence
Historical OHLC bars do not always reveal the exact sequence in which intrabar prices occurred.
If both Stop Loss and Take Profit are reachable within the same bar after the trade is active, the current engine resolves Stop Loss first.
This is intentionally conservative but may differ from the actual tick-by-tick path of the market.
Price execution
The tool uses the configured price levels for its modeled results.
It does not reproduce:
Transaction costs
The script uses a single user-defined fee percentage in its internal sizing model.
Users should choose a value that reasonably represents the venue and execution method they intend to use.
■ | 16. IMPORTANT RISK NOTES
Actual losses can exceed modeled losses because of:
The calculated executable quantity should therefore be treated as a planning estimate, not as a guarantee that realized loss will equal the configured risk exactly under every market condition.
The user remains responsible for verifying:
■ | 17. OPEN-SOURCE PURPOSE
Position Sizer v2.1 is published open-source so that TradingView users can inspect the calculations directly, understand how the sizing logic works, verify the assumptions and adapt the framework to their own research if desired.
The tool is intended to encourage a more structured approach to trade planning:
Pine Script®
This indicator is intended for educational, research and trade-planning purposes only. It does not constitute financial advice and does not place or execute orders on the user's behalf.
Position Sizer v2.1 is an open-source risk-management and trade-planning tool designed to translate a predefined trading idea into a measurable and repeatable position-sizing process.
Instead of deciding position size subjectively, the tool starts from the amount of capital available, the percentage of capital the trader is willing to risk, the intended Entry and Stop Loss prices, and the estimated trading fees.
From these inputs, it calculates an executable position size designed so that the combined loss generated by:
- the adverse price movement from Entry to Stop Loss;
- the modeled transaction costs associated with the position;
remains aligned with the predefined risk budget.
The underlying concept is:
The tool then determines how much of the selected instrument can be traded without intentionally exceeding that risk.
The purpose of Position Sizer is not to predict the market. Its purpose is to make risk measurable before a trade is taken, replacing arbitrary position sizing with a consistent and reproducible process.
The indicator supports both:
- Long positions
- Short positions
and provides a complete visual framework including Entry, Stop Loss, Take Profit, theoretical position size, executable position size, notional exposure, fees, expected loss, expected profit, trade duration and additional path-based analytics.
■ | 1. CORE WORKFLOW
The tool is designed around a simple sequence:
- Define the account balance.
- Define the maximum percentage of capital to risk.
- Select Long or Short.
- Set the Entry price.
- Set the Stop Loss price.
- Choose a Take Profit model.
- Enter the estimated transaction fee.
- Define the minimum executable quantity increment supported by the trading venue.
- Read both the theoretical and executable position size.
- Review the resulting exposure and trade statistics.
The indicator therefore works primarily as a pre-trade planning tool.
It does not generate market forecasts and does not automatically decide where Entry or Stop Loss should be placed. Those levels remain part of the user's trading methodology.
Once they are defined, the script answers a different question:
Given my capital, risk tolerance, Entry, Stop Loss and trading costs, what position size can I use without intentionally exceeding my predefined risk?
■ | 2. RISK-BASED POSITION SIZING
The first step is to calculate the monetary risk budget:
For example:
The position size is then derived from the distance between Entry and Stop Loss while also accounting for the configured transaction-cost model.
Long position
For a Long setup, the theoretical quantity is based on:
Short position
For a Short setup:
This means that the sizing engine does not consider only the raw distance between Entry and Stop Loss.
The configured fee affects the amount of exposure that can be taken.
■ | 3. THEORETICAL VS EXECUTABLE SIZE / CONT-TOLERANCE
A mathematically correct theoretical position size is not always executable on a real trading venue.
Different instruments can impose very different minimum quantity increments.
For example, one market may allow:
while another contract may require quantities to be submitted only in multiples such as:
The dashboard therefore distinguishes between two values:
- Theor. Size [COIN] - the exact mathematical quantity generated by the risk-sizing equation;
- Size [COIN] - the executable quantity after applying the CONT-Tolerance rule.
The CONT-Tolerance input represents the minimum executable quantity step.
The theoretical quantity is always rounded DOWN:
Example:
This produces the following relationship:
The script deliberately rounds downward rather than to the nearest available quantity.
Rounding upward could produce a position slightly larger than the predefined risk budget allows.
Theoretical Size answers: "What quantity does the mathematical risk model produce?"
Executable Size answers: "What quantity can actually be submitted after respecting the selected contract increment?"
■ | 4. TAKE PROFIT ENGINE
Two Take Profit models are available.
Fixed RR
The user defines a Risk/Reward multiple.
For a Long position:
For a Short position:
Example:
Fixed TP
The user can alternatively define the Take Profit price directly.
In this mode, the script calculates the resulting Risk/Reward ratio from the selected Entry, Stop Loss and Take Profit levels.
The indicator can therefore operate in both directions:
- RR -> calculate TP;
- TP -> calculate the resulting RR.
■ | 5. CHART VISUALIZATION
Position Sizer plots the three main trade levels directly on the chart:
- Entry - blue;
- Stop Loss - red;
- Take Profit - green.
Price labels are displayed alongside the active levels.
After the selected starting time, the script waits for price to actually intersect the Entry level.
The trade is considered entered when:
Until this occurs, the position remains in its Pending state.
This prevents the monitoring and PNL engines from treating a trade as active before the configured Entry has actually been reached.
■ | 6. TRADE STATE ENGINE
The tool separates the simulated trade lifecycle into three explicit states:
- Pending - Entry has not yet been reached.
- Active - price has reached Entry and the trade is being monitored.
- Closed - either Stop Loss or Take Profit has been reached.
Pending state
Before Entry is reached:
No realized trade path exists yet, so Live PNL and exposure-time analytics are intentionally inactive.
Active state
Once Entry is reached:
The script then starts monitoring price relative to Entry, TP and SL.
Closed state
When Take Profit is reached:
✅
When Stop Loss is reached:
❌
The End Date is fixed, elapsed time stops increasing, the trade path stops extending and the final PNL is frozen.
■ | 7. LIVE PNL AND CLOSED-TRADE FREEZE
Live PNL is inactive before Entry.
As long as the trade remains Pending, the dashboard displays:
This prevents market movement occurring before the planned Entry from being incorrectly interpreted as position profit or loss.
Once the Entry level has actually been reached, the dashboard begins displaying a continuously updated Live PNL based on the current market price and the calculated executable position size.
When the trade reaches either TP or SL, Live PNL stops following subsequent market prices.
The final value is instead fixed to the modeled outcome associated with the trade:
- Take Profit -> final TP PNL;
- Stop Loss -> final SL loss.
The same state logic is applied to:
- Entry Date;
- Elapsed Time;
- End Date;
- trade-status symbols;
- dynamic chart fill;
- In Profit [%] analytics.
■ | 8. DYNAMIC PROFIT / LOSS AREA
While the trade is active, the area between Entry and the current Close is dynamically colored.
For Long positions:
- green when Close is above Entry;
- red when Close is below Entry.
For Short positions the logic is reversed.
No dynamic profit/loss fill is produced while the position is still Pending.
The fill begins only after Entry is reached and exists only while the trade remains active.
Once TP or SL is reached, the trade path is considered complete and the dynamic fill stops extending into future bars.
This makes the effective exposure period visually distinguishable from both pre-entry and post-exit price action.
■ | 9. IN PROFIT [%]
The In Profit [%] metric is a path-based analytical measure designed to describe how price behaved relative to Entry during the lifetime of the trade.
The metric begins accumulating only after Entry has actually been reached.
For every active bar, the script measures:
The distance is accumulated separately depending on whether the Close is on the profitable or adverse side of Entry.
The resulting metric is:
For a Long position:
- Close > Entry contributes to the favorable sum;
- Close < Entry contributes to the adverse sum.
The conditions are reversed for Short positions.
Important: this is not literally the percentage of bars or clock time spent in profit.
It is a distance-weighted path metric.
A candle that closes far above Entry therefore contributes more favorable weight than a candle that closes only marginally above Entry.
Before Entry:
The metric stops updating when the position reaches TP or SL.
Its purpose is to provide an additional characteristic of the trade path that may later be compared with final payout, trade duration or other performance metrics.
■ | 10. POSITION DETAILS DASHBOARD
The central dashboard summarizes both the planned configuration and the realized lifecycle of the position.
Entry Date
Before Entry:
After Entry, it displays the date and, on intraday timeframes, the time at which the Entry level was first reached.
Elapsed Time
Before Entry:
Once the trade is active, it measures exposure time from the actual Entry event.
The counter stops when TP or SL closes the simulated position.
End Date
Displays:
- pending... before Entry;
- 🟡 in progress... after Entry while the position remains active;
- ✅ + closing date after Take Profit;
- ❌ + closing date after Stop Loss.
Side
Displays the selected operating direction:
- Long;
- Short.
E-SL Distance [%]
Percentage distance between Entry and Stop Loss.
Trade RR Ratio
Risk/Reward ratio implied by the currently selected Entry, Stop Loss and Take Profit configuration.
Theor. Size [COIN]
Exact theoretical quantity generated by the position-sizing equation before execution constraints are applied.
Size [COIN]
Executable quantity after rounding the theoretical size downward according to CONT-Tolerance.
The relationship is:
Size Value $
Notional value of the executable position:
Cross Lev. Ratio
Ratio between notional exposure and configured account balance:
For example:
It is an exposure ratio, not a reconstruction of a broker's liquidation or margin engine.
In Profit [%]
Distance-weighted measure of the favorable versus adverse path traveled around Entry while the position was active.
Fees [$] Cost
Estimated transaction-cost component used by the sizing model.
SL [$] Loss
Price-movement loss associated with reaching the configured Stop Loss.
The sizing calculation combines this component with modeled transaction costs when determining the theoretical maximum position size.
Because the final executable size is rounded downward, realized modeled risk may be marginally lower than the original mathematical risk budget.
PNL on TP
Expected PNL at the selected Take Profit level based on the executable position size.
Live PNL [$]
Displays:
- n/a before Entry;
- estimated mark-to-market PNL while the trade is active;
- the frozen modeled result after TP or SL.
■ | 11. TIME AND TIME ZONE MANAGEMENT
The From input defines when the tool begins monitoring the configured trade.
The script also provides a selectable time zone for displaying Entry Date and End Date.
Available options include several major market time zones, UTC and the symbol's exchange time zone.
The default is:
This timezone automatically follows the corresponding daylight-saving rules.
On intraday charts, timestamps include hours and minutes.
On higher timeframes, the dashboard displays the calendar date.
■ | 12. LONG AND SHORT SYMMETRY
The tool is designed for both directional cases.
For Long positions:
For Short positions:
The position-sizing formulas, PNL calculations, favorable/adverse path logic and TP engine adapt to the selected Side.
■ | 13. PRACTICAL WORKFLOW
A practical use of the tool can follow this sequence:
- Identify a potential trading setup using your own analytical methodology.
- Choose Long or Short.
- Place the intended Entry level.
- Define the point at which the trade thesis becomes invalid and use it as Stop Loss.
- Enter your account balance.
- Choose the maximum percentage of capital you are prepared to lose if Stop Loss is reached.
- Enter an estimated per-side fee.
- Set the instrument's minimum executable quantity increment through CONT-Tolerance.
- Choose Fixed RR or Fixed TP.
- Compare Theoretical Size with the final executable Size [COIN].
- Review notional exposure, modeled risk, fees and Cross Lev. Ratio before considering execution.
This workflow deliberately places risk before position size.
Instead of starting from:
"How large a position do I want?"
the tool starts from:
"How much capital am I prepared to lose if this trade is wrong?"
Position size becomes the result of that decision rather than the starting point.
■ | 14. WHY THIS TOOL IS DIFFERENT
Position Sizer combines several functions into a single trade-planning environment:
- fee-aware risk sizing;
- Long and Short support;
- Fixed RR and Fixed TP modes;
- explicit Theoretical Size calculation;
- minimum executable contract-size adjustment;
- automatic downward size rounding;
- final executable Size [COIN];
- notional exposure measurement;
- exposure-to-balance ratio;
- Entry / SL / TP chart visualization;
- explicit Pending / Active / Closed state tracking;
- time and timezone analytics;
- Live PNL disabled before Entry;
- frozen post-exit PNL;
- dynamic favorable/adverse chart visualization;
- distance-weighted In Profit [%] analytics.
The purpose of combining these elements is not to increase trade frequency or generate signals.
It is to make a manually planned trade measurable before execution and analyzable after the event.
■ | 15. EXECUTION ASSUMPTIONS
The indicator simulates the lifecycle of the manually configured trade using chart OHLC data.
There are several important assumptions to understand.
Entry detection
An Entry is considered reached when the bar's range contains the selected Entry price:
Until that condition occurs, the simulated trade remains Pending and Live PNL stays inactive.
Intrabar sequence
Historical OHLC bars do not always reveal the exact sequence in which intrabar prices occurred.
If both Stop Loss and Take Profit are reachable within the same bar after the trade is active, the current engine resolves Stop Loss first.
This is intentionally conservative but may differ from the actual tick-by-tick path of the market.
Price execution
The tool uses the configured price levels for its modeled results.
It does not reproduce:
- order-book depth;
- market impact;
- partial fills;
- variable bid/ask spread;
- liquidation mechanics;
- funding payments;
- maker/taker fee differences;
- exchange-specific margin rules.
Transaction costs
The script uses a single user-defined fee percentage in its internal sizing model.
Users should choose a value that reasonably represents the venue and execution method they intend to use.
■ | 16. IMPORTANT RISK NOTES
Position sizing does not make a trade safe. It defines the amount of capital exposed to a predefined scenario.
Actual losses can exceed modeled losses because of:
- gaps;
- slippage;
- low liquidity;
- rapid market moves;
- exchange outages;
- execution delays;
- liquidation rules;
- unexpected transaction costs.
The calculated executable quantity should therefore be treated as a planning estimate, not as a guarantee that realized loss will equal the configured risk exactly under every market condition.
The user remains responsible for verifying:
- minimum order quantity;
- quantity step;
- tick size;
- margin requirements;
- maximum leverage;
- fees;
- instrument specifications;
- venue-specific execution rules.
■ | 17. OPEN-SOURCE PURPOSE
Position Sizer v2.1 is published open-source so that TradingView users can inspect the calculations directly, understand how the sizing logic works, verify the assumptions and adapt the framework to their own research if desired.
The tool is intended to encourage a more structured approach to trade planning:
This indicator is intended for educational, research and trade-planning purposes only. It does not constitute financial advice and does not place or execute orders on the user's behalf.

Tg: @Ray_Burst
Exención de responsabilidad
La información y las publicaciones no constituyen, ni deben considerarse como, asesoramiento o recomendaciones financieras, de inversión, de trading u otro tipo, proporcionadas o respaldadas por TradingView. Obtenga más información en Condiciones de uso.
Tg: @Ray_Burst
Exención de responsabilidad
La información y las publicaciones no constituyen, ni deben considerarse como, asesoramiento o recomendaciones financieras, de inversión, de trading u otro tipo, proporcionadas o respaldadas por TradingView. Obtenga más información en Condiciones de uso.