OPEN-SOURCE SCRIPT
Stochastic Extreme Oscillator [MatrixQuantLabs]
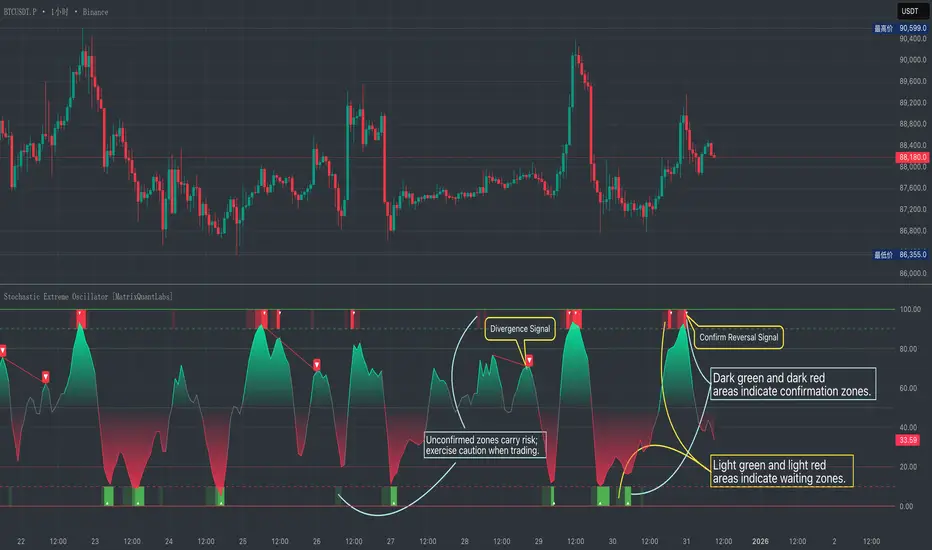
Stochastic Extreme Oscillator is an enhanced stochastic-based oscillator designed to highlight market extremes, momentum shifts, and potential reversal zones with improved visual clarity and signal filtering.
This indicator builds upon the classic Stochastic Oscillator by focusing on extreme zone behavior, peak & trough signals, and optional divergence detection, making it suitable for both discretionary and systematic traders.
Key Features
Extreme Zone Visualization
• Multi-level overbought (80–100) and oversold (0–20) zones with adaptive color intensity help assess the strength and risk level of market extremes at a glance.
Momentum-Aware Coloring
• The %D line dynamically changes color based on its position relative to the zero line, providing an intuitive view of bullish, neutral, and bearish momentum states.
Peak & Trough Signals
• Optional bullish and bearish signals are triggered only when %K / %D cross occurs inside extreme zones, helping filter out low-quality signals in mid-range conditions.
Regular Divergence Detection
• Built-in bullish and bearish divergence detection based on pivot structure, allowing early identification of potential trend reversals.
Clean & Focused Design
• The indicator emphasizes the %D line as the primary signal source, while %K is used internally for logic, keeping the chart uncluttered and easy to read.
Customization
• Adjustable %K / %D lengths and smoothing
• Toggle peak & trough signals on/off
• Optional divergence detection with configurable pivot sensitivity
• Designed to work across different markets and timeframes
Usage Notes

• Best used as a momentum and extreme-condition oscillator, not as a standalone trading system
• Signals are most effective when combined with trend context, price structure, or higher-timeframe analysis
• Divergence signals may appear with delay due to pivot confirmation logic
Disclaimer
This indicator is intended for educational and analytical purposes only and does not constitute financial advice. Always apply proper risk management and confirm signals with additional analysis.
This indicator builds upon the classic Stochastic Oscillator by focusing on extreme zone behavior, peak & trough signals, and optional divergence detection, making it suitable for both discretionary and systematic traders.
Key Features
Extreme Zone Visualization
• Multi-level overbought (80–100) and oversold (0–20) zones with adaptive color intensity help assess the strength and risk level of market extremes at a glance.
Momentum-Aware Coloring
• The %D line dynamically changes color based on its position relative to the zero line, providing an intuitive view of bullish, neutral, and bearish momentum states.
Peak & Trough Signals
• Optional bullish and bearish signals are triggered only when %K / %D cross occurs inside extreme zones, helping filter out low-quality signals in mid-range conditions.
Regular Divergence Detection
• Built-in bullish and bearish divergence detection based on pivot structure, allowing early identification of potential trend reversals.
Clean & Focused Design
• The indicator emphasizes the %D line as the primary signal source, while %K is used internally for logic, keeping the chart uncluttered and easy to read.
Customization
• Adjustable %K / %D lengths and smoothing
• Toggle peak & trough signals on/off
• Optional divergence detection with configurable pivot sensitivity
• Designed to work across different markets and timeframes
Usage Notes
• Best used as a momentum and extreme-condition oscillator, not as a standalone trading system
• Signals are most effective when combined with trend context, price structure, or higher-timeframe analysis
• Divergence signals may appear with delay due to pivot confirmation logic
Disclaimer
This indicator is intended for educational and analytical purposes only and does not constitute financial advice. Always apply proper risk management and confirm signals with additional analysis.
Script de código abierto
Fiel al espíritu de TradingView, el creador de este script lo ha convertido en código abierto, para que los traders puedan revisar y verificar su funcionalidad. ¡Enhorabuena al autor! Aunque puede utilizarlo de forma gratuita, recuerde que cualquier republicación del código está sujeta a nuestras Normas internas.

If you had known me sooner, You would have been in awe of this market!
Exención de responsabilidad
La información y las publicaciones no constituyen, ni deben considerarse como, asesoramiento o recomendaciones financieras, de inversión, de trading u otro tipo, proporcionadas o respaldadas por TradingView. Obtenga más información en Condiciones de uso.
Script de código abierto
Fiel al espíritu de TradingView, el creador de este script lo ha convertido en código abierto, para que los traders puedan revisar y verificar su funcionalidad. ¡Enhorabuena al autor! Aunque puede utilizarlo de forma gratuita, recuerde que cualquier republicación del código está sujeta a nuestras Normas internas.
If you had known me sooner, You would have been in awe of this market!
Exención de responsabilidad
La información y las publicaciones no constituyen, ni deben considerarse como, asesoramiento o recomendaciones financieras, de inversión, de trading u otro tipo, proporcionadas o respaldadas por TradingView. Obtenga más información en Condiciones de uso.