OPEN-SOURCE SCRIPT
RSI Moving Average Crossovers by KD
**Indicator Description:**
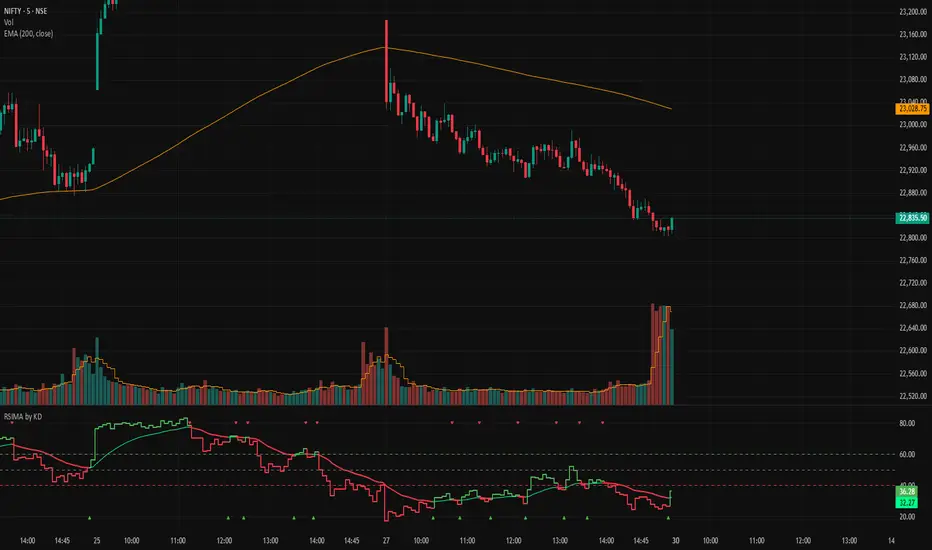
RSI Moving Average Crossovers (RSIMAC) is a powerful momentum indicator that plots the Relative Strength Index (RSI) along with its moving average.
The RSI line dynamically changes color based on whether it is trading **above** or **below** its MA. The RSI MA line also changes color accordingly, making trend shifts and momentum strength visually clear at a glance. The area between the RSI and its MA is filled with corresponding bullish or bearish colors.
Key features include:
- Customizable RSI and RSI MA colors
- Dynamic fill between RSI and its moving average
- Visual crossover signals for both RSI/MA and Fast/Slow price MAs
- Trend-based background coloring and a compact screener table
Ideal for identifying momentum shifts, overbought/oversold conditions, and potential reversals.
---
"RSI with dynamic coloring based on its moving average. RSI and RSI MA lines change color when RSI crosses above or below the MA. Includes fill, crossover signals, price MA trend detection, and a live screener table."
---
RSI Moving Average Crossovers (RSIMAC) is a powerful momentum indicator that plots the Relative Strength Index (RSI) along with its moving average.
The RSI line dynamically changes color based on whether it is trading **above** or **below** its MA. The RSI MA line also changes color accordingly, making trend shifts and momentum strength visually clear at a glance. The area between the RSI and its MA is filled with corresponding bullish or bearish colors.
Key features include:
- Customizable RSI and RSI MA colors
- Dynamic fill between RSI and its moving average
- Visual crossover signals for both RSI/MA and Fast/Slow price MAs
- Trend-based background coloring and a compact screener table
Ideal for identifying momentum shifts, overbought/oversold conditions, and potential reversals.
---
"RSI with dynamic coloring based on its moving average. RSI and RSI MA lines change color when RSI crosses above or below the MA. Includes fill, crossover signals, price MA trend detection, and a live screener table."
---
Script de código abierto
Fiel al espíritu de TradingView, el creador de este script lo ha convertido en código abierto, para que los traders puedan revisar y verificar su funcionalidad. ¡Enhorabuena al autor! Aunque puede utilizarlo de forma gratuita, recuerde que cualquier republicación del código está sujeta a nuestras Normas internas.

Exención de responsabilidad
La información y las publicaciones no constituyen, ni deben considerarse como, asesoramiento o recomendaciones financieras, de inversión, de trading u otro tipo, proporcionadas o respaldadas por TradingView. Obtenga más información en Condiciones de uso.
Script de código abierto
Fiel al espíritu de TradingView, el creador de este script lo ha convertido en código abierto, para que los traders puedan revisar y verificar su funcionalidad. ¡Enhorabuena al autor! Aunque puede utilizarlo de forma gratuita, recuerde que cualquier republicación del código está sujeta a nuestras Normas internas.
Exención de responsabilidad
La información y las publicaciones no constituyen, ni deben considerarse como, asesoramiento o recomendaciones financieras, de inversión, de trading u otro tipo, proporcionadas o respaldadas por TradingView. Obtenga más información en Condiciones de uso.