daily highs and lows
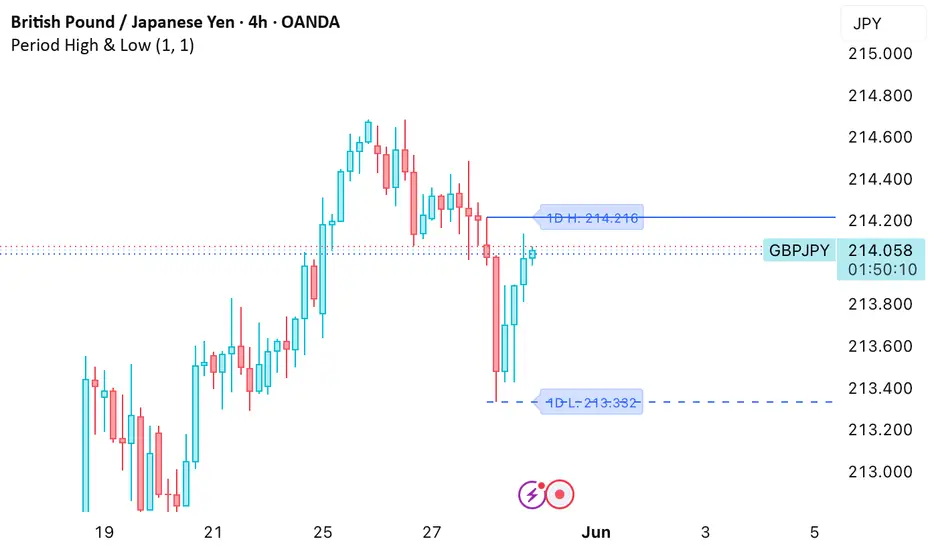
Here's a clean, simple description:
Plots the highest high and lowest low over a set number of days directly on your chart. Useful for quickly spotting key support and resistance levels without any clutter.
Settings:
Days — how far back to look
Color — line color
Line Width — thickness of the lines
Show Labels — toggle the H/L labels on or off
Extend Right — extends the lines to the right of the chart
Solid line is the high, dashed line is the low.
Plots the highest high and lowest low over a set number of days directly on your chart. Useful for quickly spotting key support and resistance levels without any clutter.
Settings:
Days — how far back to look
Color — line color
Line Width — thickness of the lines
Show Labels — toggle the H/L labels on or off
Extend Right — extends the lines to the right of the chart
Solid line is the high, dashed line is the low.

Exención de responsabilidad
La información y las publicaciones no constituyen, ni deben considerarse como, asesoramiento o recomendaciones financieras, de inversión, de trading u otro tipo, proporcionadas o respaldadas por TradingView. Obtenga más información en Condiciones de uso.
Exención de responsabilidad
La información y las publicaciones no constituyen, ni deben considerarse como, asesoramiento o recomendaciones financieras, de inversión, de trading u otro tipo, proporcionadas o respaldadas por TradingView. Obtenga más información en Condiciones de uso.