OPEN-SOURCE SCRIPT
Average Price History Candle
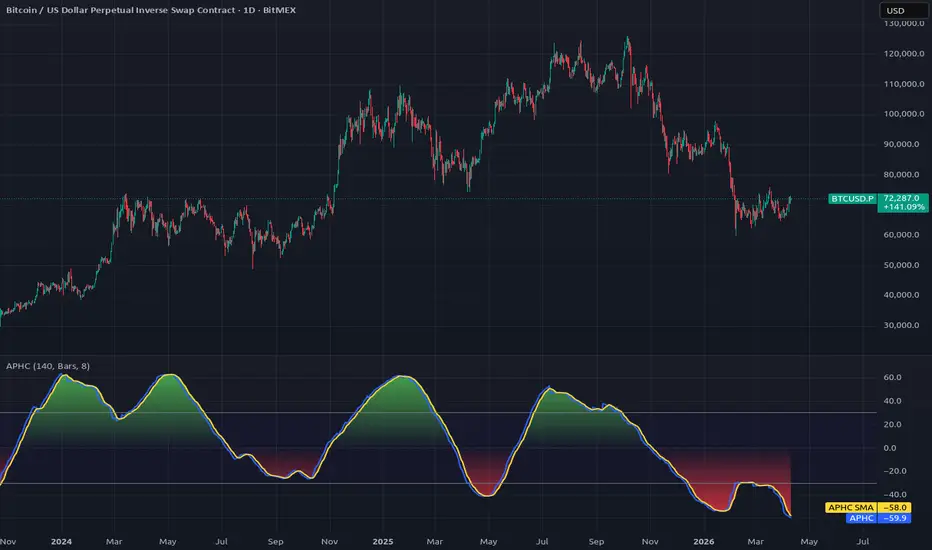
The Average Price History Candle indicator (APHC) is my own invention and is entirely new.
It's calculated from a time period, specified by a number of bars, hours or days.
It's basically one candle calculated from the average price history, with the high and low being that of the specified time period.
The open is the average (SMA) of the first half of the time period.
The close is the average (SMA) of the second half of the time period.
The plot is the size of the candle body expressed as a percentage of the whole price range, with positive being bullish and negative bearish.
It generally resembles a sine wave more or less, as the momentume shifts from bullish to bearish and back again.
Because it's fairly consistant and predictable, it gives a good indication where the market momentum is going next.
It also seems to work quite well with divergences.
Using a time period of a very few bars, say 6 or 8, it behaves more like an RSI or Stochastic.
But to be honest, I've not had much chance to explore all the different ways in which this indicator could be used to provide useful trading information.
Please leave ideas in the comments if you find ways in which you find it useful. Thanks.
It's calculated from a time period, specified by a number of bars, hours or days.
It's basically one candle calculated from the average price history, with the high and low being that of the specified time period.
The open is the average (SMA) of the first half of the time period.
The close is the average (SMA) of the second half of the time period.
The plot is the size of the candle body expressed as a percentage of the whole price range, with positive being bullish and negative bearish.
It generally resembles a sine wave more or less, as the momentume shifts from bullish to bearish and back again.
Because it's fairly consistant and predictable, it gives a good indication where the market momentum is going next.
It also seems to work quite well with divergences.
Using a time period of a very few bars, say 6 or 8, it behaves more like an RSI or Stochastic.
But to be honest, I've not had much chance to explore all the different ways in which this indicator could be used to provide useful trading information.
Please leave ideas in the comments if you find ways in which you find it useful. Thanks.
Script de código abierto
Fiel al espíritu de TradingView, el creador de este script lo ha convertido en código abierto, para que los traders puedan revisar y verificar su funcionalidad. ¡Enhorabuena al autor! Aunque puede utilizarlo de forma gratuita, recuerde que cualquier republicación del código está sujeta a nuestras Normas internas.

Exención de responsabilidad
La información y las publicaciones no constituyen, ni deben considerarse como, asesoramiento o recomendaciones financieras, de inversión, de trading u otro tipo, proporcionadas o respaldadas por TradingView. Obtenga más información en Condiciones de uso.
Script de código abierto
Fiel al espíritu de TradingView, el creador de este script lo ha convertido en código abierto, para que los traders puedan revisar y verificar su funcionalidad. ¡Enhorabuena al autor! Aunque puede utilizarlo de forma gratuita, recuerde que cualquier republicación del código está sujeta a nuestras Normas internas.
Exención de responsabilidad
La información y las publicaciones no constituyen, ni deben considerarse como, asesoramiento o recomendaciones financieras, de inversión, de trading u otro tipo, proporcionadas o respaldadas por TradingView. Obtenga más información en Condiciones de uso.