OPEN-SOURCE SCRIPT
RichmondHillCM - BTC vs Business Cycle (ISM PMI)
BTC vs Business Cycle (ISM PMI)
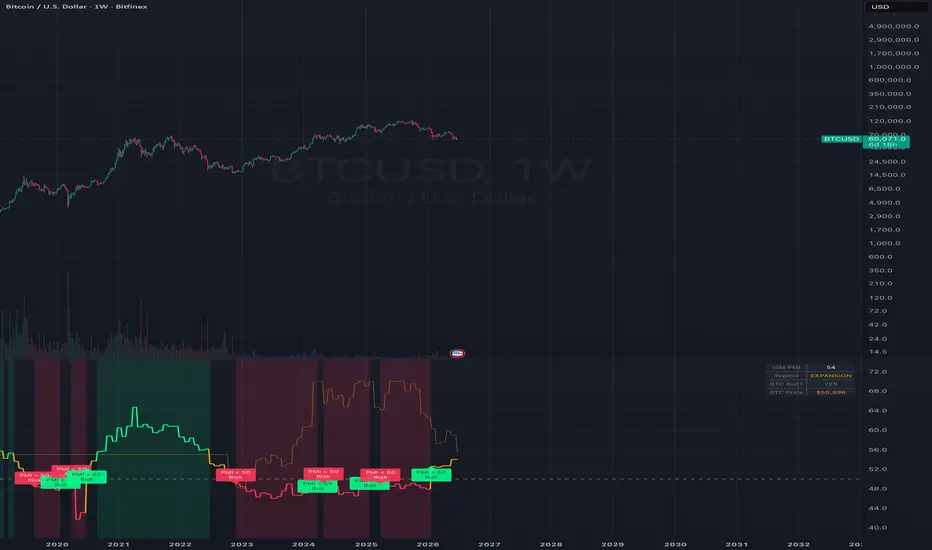
This indicator overlays the U.S. ISM Manufacturing PMI against Bitcoin price to help you frame BTC within the broader macro/business cycle. The idea is simple: manufacturing activity is a classic gauge of economic momentum, and BTC has historically behaved differently in expansionary versus contractionary macro environments. This tool makes that relationship visible at a glance.
What it does
It pulls monthly PMI data and monthly BTC price, then normalizes Bitcoin into the PMI's 40–70 range so both can be read on the same scale. The PMI line is color-coded by regime, and Bitcoin is plotted alongside it for easy comparison.
Regime classification
Expansion — PMI at or above 50 (amber)
Strong Expansion / Bull — PMI at or above the Bull Threshold, default 55 (green)
Contraction — PMI below 50 (red)
The 50 level marks the expansion/contraction boundary, and a configurable Bull Threshold marks the stronger-momentum zone. Background shading highlights contraction and strong-bull periods, and labels mark the moments PMI crosses 50 in either direction.
Reading the panel
A live info table (top-right) summarizes the current PMI value, the active regime, whether BTC is in a "bull-supportive" macro environment, and the latest BTC price.
Inputs
PMI Symbol — the data feed for PMI. Availability depends on your TradingView data access. If the default doesn't load, try alternates such as FRED:NAPM, ECONOMICS:USPMI, or another ISM/PMI source your plan supports.
Bull PMI Threshold — adjusts where the "strong expansion" zone begins.
Shade Regimes — toggles background shading on/off.
Notes
This is a macro-context tool, not a timing or entry/exit signal generator. PMI is monthly and released with a lag, so treat it as a regime backdrop rather than a trade trigger. Not financial advice — do your own research.
This indicator overlays the U.S. ISM Manufacturing PMI against Bitcoin price to help you frame BTC within the broader macro/business cycle. The idea is simple: manufacturing activity is a classic gauge of economic momentum, and BTC has historically behaved differently in expansionary versus contractionary macro environments. This tool makes that relationship visible at a glance.
What it does
It pulls monthly PMI data and monthly BTC price, then normalizes Bitcoin into the PMI's 40–70 range so both can be read on the same scale. The PMI line is color-coded by regime, and Bitcoin is plotted alongside it for easy comparison.
Regime classification
Expansion — PMI at or above 50 (amber)
Strong Expansion / Bull — PMI at or above the Bull Threshold, default 55 (green)
Contraction — PMI below 50 (red)
The 50 level marks the expansion/contraction boundary, and a configurable Bull Threshold marks the stronger-momentum zone. Background shading highlights contraction and strong-bull periods, and labels mark the moments PMI crosses 50 in either direction.
Reading the panel
A live info table (top-right) summarizes the current PMI value, the active regime, whether BTC is in a "bull-supportive" macro environment, and the latest BTC price.
Inputs
PMI Symbol — the data feed for PMI. Availability depends on your TradingView data access. If the default doesn't load, try alternates such as FRED:NAPM, ECONOMICS:USPMI, or another ISM/PMI source your plan supports.
Bull PMI Threshold — adjusts where the "strong expansion" zone begins.
Shade Regimes — toggles background shading on/off.
Notes
This is a macro-context tool, not a timing or entry/exit signal generator. PMI is monthly and released with a lag, so treat it as a regime backdrop rather than a trade trigger. Not financial advice — do your own research.
Script de código abierto
Fiel al espíritu de TradingView, el creador de este script lo ha convertido en código abierto, para que los traders puedan revisar y verificar su funcionalidad. ¡Enhorabuena al autor! Aunque puede utilizarlo de forma gratuita, recuerde que cualquier republicación del código está sujeta a nuestras Normas internas.

Exención de responsabilidad
La información y las publicaciones no constituyen, ni deben considerarse como, asesoramiento o recomendaciones financieras, de inversión, de trading u otro tipo, proporcionadas o respaldadas por TradingView. Obtenga más información en Condiciones de uso.
Script de código abierto
Fiel al espíritu de TradingView, el creador de este script lo ha convertido en código abierto, para que los traders puedan revisar y verificar su funcionalidad. ¡Enhorabuena al autor! Aunque puede utilizarlo de forma gratuita, recuerde que cualquier republicación del código está sujeta a nuestras Normas internas.
Exención de responsabilidad
La información y las publicaciones no constituyen, ni deben considerarse como, asesoramiento o recomendaciones financieras, de inversión, de trading u otro tipo, proporcionadas o respaldadas por TradingView. Obtenga más información en Condiciones de uso.