OPEN-SOURCE SCRIPT
Trinity Hull MA + Multi-TF Dashboard
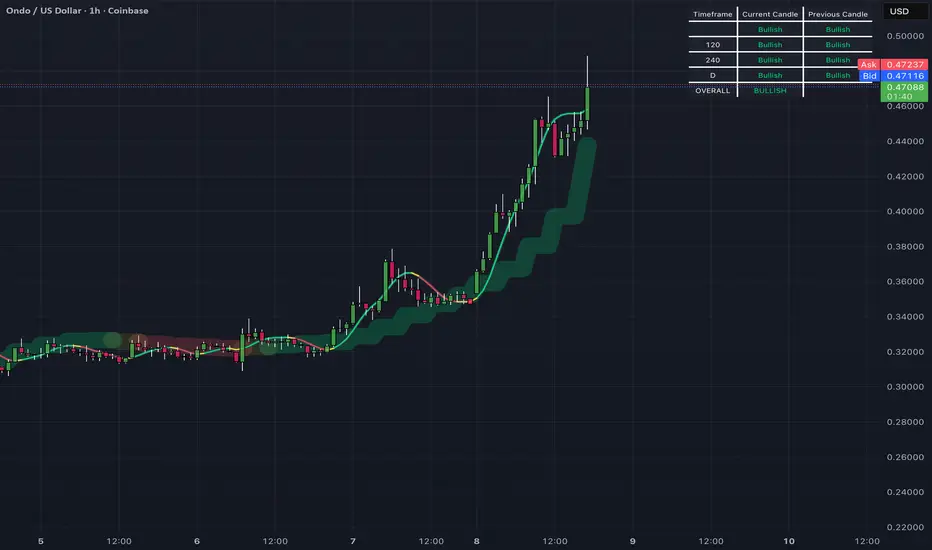
**Trinity Hull MA + Multi-TF Dashboard – Full User Guide**
This indicator combines a fast Hull Moving Average for precise entries with a slower Hull MA for trend filtering and a multi-timeframe dashboard that gives you a quick snapshot of the overall market bias. Everything is built on the same Hull MA calculation, so the signals stay consistent across the chart and the dashboard.
### 1. How the Indicator Works – The Two Hull MAs
**First Hull MA (Thin Colored Line + Optional Arrows)**
This is your entry tool.
- It plots a thin line that changes color in real time:
- **Lime** = strong bullish momentum (price is accelerating upward)
- **Red** = strong bearish momentum (price is accelerating downward)
- **Yellow** = reversing or choppy (momentum is flattening or changing direction)
- A black background line can be turned on for extra visibility.
- You can enable small aqua/red arrows that mark exact turning points on the 1st MA’s timeframe.
- Use this line for timing your actual entries and exits. It reacts quickly and is great for catching short-term moves.
**Second Hull MA (Thick Colored Zones)**
This is your trend filter and “warning zone” tool.
- It plots a much thicker line (linewidth 25 with transparency) behind the price.
- The thick zones tell you the higher-timeframe trend at a glance:
- **Lime background** = higher-timeframe bullish trend (stay long or look for buys)
- **Red background** = higher-timeframe bearish trend (stay short or look for sells)
- **Yellow background** = the higher-timeframe trend is weakening or reversing (caution – reduce size or prepare to exit)
- By default it uses the 4-hour timeframe, but you can change it.
- Think of the second Hull MA as your “big picture” filter. Only take trades in the direction of the thick zone color. When the thick zone turns yellow it often signals that the current trend is losing strength, even if the thin line is still moving.
The two MAs work together: the thin line gives you the entry timing, while the thick zones keep you on the right side of the larger trend.
### 2. The Multi-TF Dashboard
The dashboard appears in the corner you choose and shows four different timeframes side by side.
For each timeframe it displays:
- The **Current** bar state (Bullish, Bearish, or Neutral)
- The **Previous** completed bar state
The dashboard also calculates an **OVERALL** recommendation at the bottom based on majority vote across the four current states (3 or more Bullish = BULLISH, 3 or more Bearish = BEARISH, otherwise NEUTRAL).
This gives you instant confluence. For example, if three of the four timeframes are showing Bullish on the current bar, the overall label turns bright green and you know the broader market bias is bullish.
### 3. Recommended Settings
**Scalping Settings (Fast, Intraday Trading – 1min to 15min charts)**
- Hull Period: 9 (default – keep it fast)
- 1st MA Timeframe: Current chart or “15”
- 2nd MA Timeframe: “60” or “240” (use the next higher timeframe as filter)
- Show 2nd MA (Trend Line): ON
- Dashboard Timeframes: 5, 15, 60, 240
- Table Size: Tiny or Small
- Color Mode: Dark (best contrast on most charts)
With these settings the thin line gives rapid signals while the thick zones and dashboard keep you from fighting the short-term trend.
**Swing Trading Settings (Higher Timeframes – 1H to Daily charts)**
- Hull Period: 16 or 21 (slower and smoother)
- 1st MA Timeframe: Current chart or “240”
- 2nd MA Timeframe: “D” (daily) or “W” (weekly)
- Show 2nd MA (Trend Line): ON
- Dashboard Timeframes: 60, 240, D, W
- Table Size: Medium or Large (easier to read on higher timeframes)
- Color Mode: Dark or Light depending on your chart background
Here the second Hull MA becomes your primary trend filter, and the dashboard shows you alignment across multiple higher timeframes before you commit to a swing position.
### 4. How to Trade with the Indicator
**Basic Trading Rules**
1. Look at the **thick colored zones** first – only trade in the direction of the dominant color (lime or red).
2. Wait for the **thin line** to turn the same color as the thick zones and show strong momentum (lime/red, not yellow).
3. Check the **dashboard** for overall confluence. The overall label should match your trade direction.
4. Optional: use the arrows on the thin line as extra confirmation for entries.
**Example Long Trade**
- Thick zone is lime
- Thin line turns lime and stays lime
- Dashboard shows at least 3 Bullish on current bars
→ Enter long. Exit when the thin line turns yellow or the thick zone changes color.
**Risk Management Tip**
When the thick zone turns yellow or the dashboard overall label flips to Neutral, it is usually time to tighten stops or exit. The indicator is excellent at warning you before major reversals.
### 5. Customizing the Dashboard
- **Table Position**: Choose where the dashboard appears (Top Right, Bottom Left, etc.). You can still drag the table manually on the chart after it appears.
- **Table Size**: Tiny, Small, Medium, or Large – controls text size so you can make it very compact for scalping or larger for swing charts.
- **Color Mode**: Dark or Light – pick whichever gives the best contrast against your yellow background.
- All four dashboard timeframes are fully customizable in the inputs.
The entire indicator updates in real time and works on any symbol and any chart timeframe.
You now have everything you need to use the Trinity Hull MA confidently for both scalping and swing trading. Load the script, adjust the settings for your style, and let the combination of the fast entry line, the thick trend filter, and the multi-timeframe dashboard guide your decisions.
This indicator combines a fast Hull Moving Average for precise entries with a slower Hull MA for trend filtering and a multi-timeframe dashboard that gives you a quick snapshot of the overall market bias. Everything is built on the same Hull MA calculation, so the signals stay consistent across the chart and the dashboard.
### 1. How the Indicator Works – The Two Hull MAs
**First Hull MA (Thin Colored Line + Optional Arrows)**
This is your entry tool.
- It plots a thin line that changes color in real time:
- **Lime** = strong bullish momentum (price is accelerating upward)
- **Red** = strong bearish momentum (price is accelerating downward)
- **Yellow** = reversing or choppy (momentum is flattening or changing direction)
- A black background line can be turned on for extra visibility.
- You can enable small aqua/red arrows that mark exact turning points on the 1st MA’s timeframe.
- Use this line for timing your actual entries and exits. It reacts quickly and is great for catching short-term moves.
**Second Hull MA (Thick Colored Zones)**
This is your trend filter and “warning zone” tool.
- It plots a much thicker line (linewidth 25 with transparency) behind the price.
- The thick zones tell you the higher-timeframe trend at a glance:
- **Lime background** = higher-timeframe bullish trend (stay long or look for buys)
- **Red background** = higher-timeframe bearish trend (stay short or look for sells)
- **Yellow background** = the higher-timeframe trend is weakening or reversing (caution – reduce size or prepare to exit)
- By default it uses the 4-hour timeframe, but you can change it.
- Think of the second Hull MA as your “big picture” filter. Only take trades in the direction of the thick zone color. When the thick zone turns yellow it often signals that the current trend is losing strength, even if the thin line is still moving.
The two MAs work together: the thin line gives you the entry timing, while the thick zones keep you on the right side of the larger trend.
### 2. The Multi-TF Dashboard
The dashboard appears in the corner you choose and shows four different timeframes side by side.
For each timeframe it displays:
- The **Current** bar state (Bullish, Bearish, or Neutral)
- The **Previous** completed bar state
The dashboard also calculates an **OVERALL** recommendation at the bottom based on majority vote across the four current states (3 or more Bullish = BULLISH, 3 or more Bearish = BEARISH, otherwise NEUTRAL).
This gives you instant confluence. For example, if three of the four timeframes are showing Bullish on the current bar, the overall label turns bright green and you know the broader market bias is bullish.
### 3. Recommended Settings
**Scalping Settings (Fast, Intraday Trading – 1min to 15min charts)**
- Hull Period: 9 (default – keep it fast)
- 1st MA Timeframe: Current chart or “15”
- 2nd MA Timeframe: “60” or “240” (use the next higher timeframe as filter)
- Show 2nd MA (Trend Line): ON
- Dashboard Timeframes: 5, 15, 60, 240
- Table Size: Tiny or Small
- Color Mode: Dark (best contrast on most charts)
With these settings the thin line gives rapid signals while the thick zones and dashboard keep you from fighting the short-term trend.
**Swing Trading Settings (Higher Timeframes – 1H to Daily charts)**
- Hull Period: 16 or 21 (slower and smoother)
- 1st MA Timeframe: Current chart or “240”
- 2nd MA Timeframe: “D” (daily) or “W” (weekly)
- Show 2nd MA (Trend Line): ON
- Dashboard Timeframes: 60, 240, D, W
- Table Size: Medium or Large (easier to read on higher timeframes)
- Color Mode: Dark or Light depending on your chart background
Here the second Hull MA becomes your primary trend filter, and the dashboard shows you alignment across multiple higher timeframes before you commit to a swing position.
### 4. How to Trade with the Indicator
**Basic Trading Rules**
1. Look at the **thick colored zones** first – only trade in the direction of the dominant color (lime or red).
2. Wait for the **thin line** to turn the same color as the thick zones and show strong momentum (lime/red, not yellow).
3. Check the **dashboard** for overall confluence. The overall label should match your trade direction.
4. Optional: use the arrows on the thin line as extra confirmation for entries.
**Example Long Trade**
- Thick zone is lime
- Thin line turns lime and stays lime
- Dashboard shows at least 3 Bullish on current bars
→ Enter long. Exit when the thin line turns yellow or the thick zone changes color.
**Risk Management Tip**
When the thick zone turns yellow or the dashboard overall label flips to Neutral, it is usually time to tighten stops or exit. The indicator is excellent at warning you before major reversals.
### 5. Customizing the Dashboard
- **Table Position**: Choose where the dashboard appears (Top Right, Bottom Left, etc.). You can still drag the table manually on the chart after it appears.
- **Table Size**: Tiny, Small, Medium, or Large – controls text size so you can make it very compact for scalping or larger for swing charts.
- **Color Mode**: Dark or Light – pick whichever gives the best contrast against your yellow background.
- All four dashboard timeframes are fully customizable in the inputs.
The entire indicator updates in real time and works on any symbol and any chart timeframe.
You now have everything you need to use the Trinity Hull MA confidently for both scalping and swing trading. Load the script, adjust the settings for your style, and let the combination of the fast entry line, the thick trend filter, and the multi-timeframe dashboard guide your decisions.
Script de código abierto
Fiel al espíritu de TradingView, el creador de este script lo ha convertido en código abierto, para que los traders puedan revisar y verificar su funcionalidad. ¡Enhorabuena al autor! Aunque puede utilizarlo de forma gratuita, recuerde que cualquier republicación del código está sujeta a nuestras Normas internas.

Exención de responsabilidad
La información y las publicaciones no constituyen, ni deben considerarse como, asesoramiento o recomendaciones financieras, de inversión, de trading u otro tipo, proporcionadas o respaldadas por TradingView. Obtenga más información en Condiciones de uso.
Script de código abierto
Fiel al espíritu de TradingView, el creador de este script lo ha convertido en código abierto, para que los traders puedan revisar y verificar su funcionalidad. ¡Enhorabuena al autor! Aunque puede utilizarlo de forma gratuita, recuerde que cualquier republicación del código está sujeta a nuestras Normas internas.
Exención de responsabilidad
La información y las publicaciones no constituyen, ni deben considerarse como, asesoramiento o recomendaciones financieras, de inversión, de trading u otro tipo, proporcionadas o respaldadas por TradingView. Obtenga más información en Condiciones de uso.