OPEN-SOURCE SCRIPT
TS Pressure Oscillator
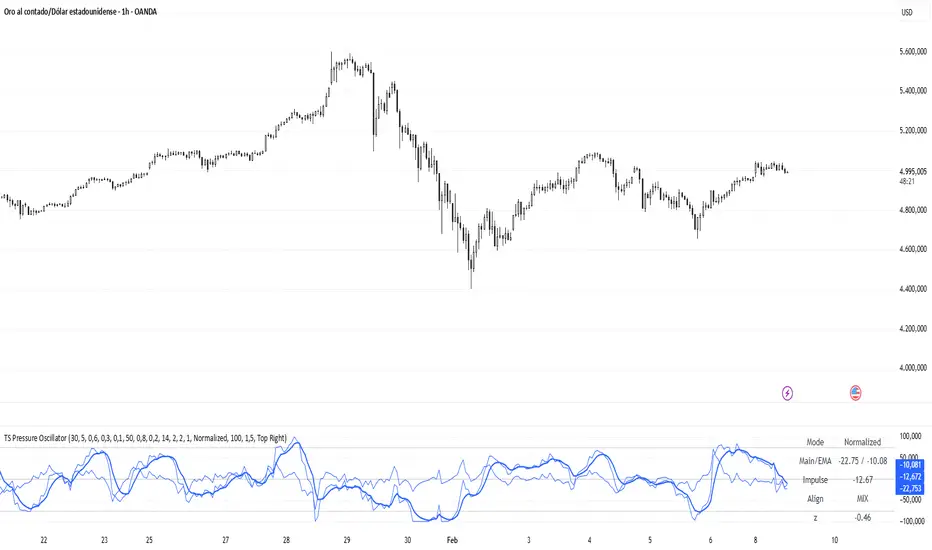
This indicator is a TS Pressure Oscillator. Its job is to turn a lot of small “TS events” (liquidity sweeps + rejection) into a single, easy-to-read curve that helps you spot short-term exhaustion and possible trend shifts.
What it detects (TS events)
A “TS” here means a candle that:
briefly breaks the previous candle’s high and then closes back below it (bearish rejection), or
briefly breaks the previous candle’s low and then closes back above it (bullish rejection).
In simple words: price tried to continue, failed, and got rejected.
What the oscillator measures
Instead of counting every TS equally, this version gives each event a score based on its quality:
Wick size vs ATR (how meaningful the sweep was)
Body size vs ATR (how strong the rejection candle was)
Then it filters events by context:
bearish TS only matter most near the top of a recent range
bullish TS only matter most near the bottom of a recent range
After that, it combines multiple timeframes (M15 / M5 / M1) into one curve:
If bearish TS pressure dominates, the oscillator tends to move up (more rejection from above).
If bullish TS pressure dominates, the oscillator tends to move down (more rejection from below).
Why there are two lines (Main vs EMA)
Main line shows the current pressure.
EMA line is the smoothed version (the “trend” of the pressure).
The gap between them is useful: when the Main line pulls away from the EMA, it often means pressure is accelerating.
The most important part: parameters
This indicator is only as good as its tuning. The key settings control what it considers “relevant” TS events:
Zone lookback (HH/LL): defines what “top” and “bottom” mean
Zone thresholds (zoneHi / zoneLo): how strict the “extreme area” filter is
Window lengths per timeframe: how much history you’re measuring
ATR length + caps: how sensitive the scoring is
Baseline: prevents the oscillator from sticking at extremes
If your parameters are too loose, you’ll get noise.
If they’re too strict, you’ll miss opportunities.
Dialing them in for each asset/session is the difference between a “nice curve” and a useful signal.
If you want, tell me the asset (e.g., XAUUSD) and your main chart timeframe, and I’ll suggest a solid starting preset for the parameters.
What it detects (TS events)
A “TS” here means a candle that:
briefly breaks the previous candle’s high and then closes back below it (bearish rejection), or
briefly breaks the previous candle’s low and then closes back above it (bullish rejection).
In simple words: price tried to continue, failed, and got rejected.
What the oscillator measures
Instead of counting every TS equally, this version gives each event a score based on its quality:
Wick size vs ATR (how meaningful the sweep was)
Body size vs ATR (how strong the rejection candle was)
Then it filters events by context:
bearish TS only matter most near the top of a recent range
bullish TS only matter most near the bottom of a recent range
After that, it combines multiple timeframes (M15 / M5 / M1) into one curve:
If bearish TS pressure dominates, the oscillator tends to move up (more rejection from above).
If bullish TS pressure dominates, the oscillator tends to move down (more rejection from below).
Why there are two lines (Main vs EMA)
Main line shows the current pressure.
EMA line is the smoothed version (the “trend” of the pressure).
The gap between them is useful: when the Main line pulls away from the EMA, it often means pressure is accelerating.
The most important part: parameters
This indicator is only as good as its tuning. The key settings control what it considers “relevant” TS events:
Zone lookback (HH/LL): defines what “top” and “bottom” mean
Zone thresholds (zoneHi / zoneLo): how strict the “extreme area” filter is
Window lengths per timeframe: how much history you’re measuring
ATR length + caps: how sensitive the scoring is
Baseline: prevents the oscillator from sticking at extremes
If your parameters are too loose, you’ll get noise.
If they’re too strict, you’ll miss opportunities.
Dialing them in for each asset/session is the difference between a “nice curve” and a useful signal.
If you want, tell me the asset (e.g., XAUUSD) and your main chart timeframe, and I’ll suggest a solid starting preset for the parameters.
Script de código abierto
Fiel al espíritu de TradingView, el creador de este script lo ha convertido en código abierto, para que los traders puedan revisar y verificar su funcionalidad. ¡Enhorabuena al autor! Aunque puede utilizarlo de forma gratuita, recuerde que cualquier republicación del código está sujeta a nuestras Normas internas.

Exención de responsabilidad
La información y las publicaciones no constituyen, ni deben considerarse como, asesoramiento o recomendaciones financieras, de inversión, de trading u otro tipo, proporcionadas o respaldadas por TradingView. Obtenga más información en Condiciones de uso.
Script de código abierto
Fiel al espíritu de TradingView, el creador de este script lo ha convertido en código abierto, para que los traders puedan revisar y verificar su funcionalidad. ¡Enhorabuena al autor! Aunque puede utilizarlo de forma gratuita, recuerde que cualquier republicación del código está sujeta a nuestras Normas internas.
Exención de responsabilidad
La información y las publicaciones no constituyen, ni deben considerarse como, asesoramiento o recomendaciones financieras, de inversión, de trading u otro tipo, proporcionadas o respaldadas por TradingView. Obtenga más información en Condiciones de uso.