OPEN-SOURCE SCRIPT
Institutional SMC Volume Profile Regression [Pro]
Institutional Volume Profile Regression [Pro]
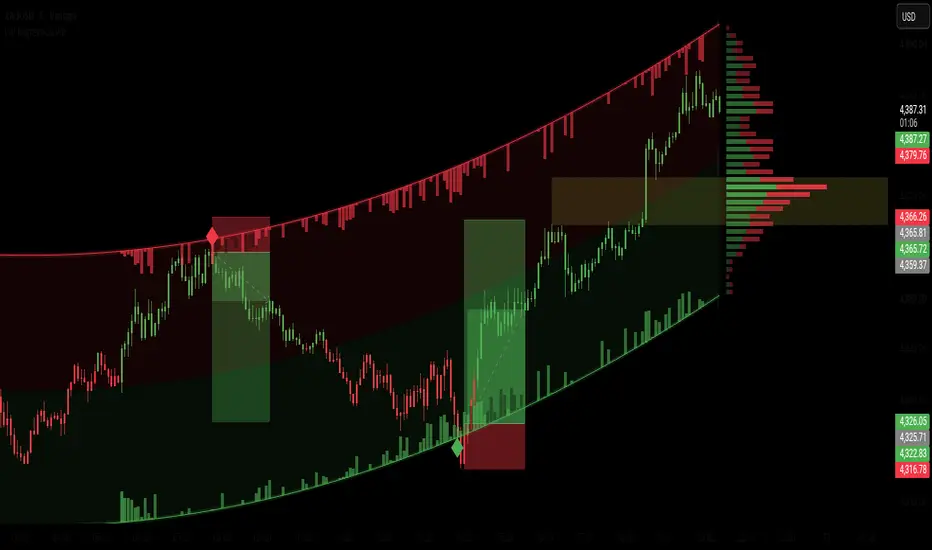
Institutional Volume Profile Regression [Pro] combines polynomial curve fitting with structural volume distribution analysis to visualize dynamic order flow directly on the chart. It overlays inward volume pressure bars along standard deviation bounds and compiles an end-of-channel volume distribution profile.
Key Features
1. Polynomial Regression Channel Model
Computes a dynamic quadratic curve through matrix operations, creating an adaptive trend baseline that adjusts smoothly to medium-term volatility shifts without lagging.
2. Inward Dynamic Volume Pressure Bars
Renders directional buy and sell volume flow pointing inward from channel boundaries. Bullish accumulation builds from the lower band, while bearish distribution projects down from the upper band.
3. Boundary Volatility Contact Indicators
Marks first-contact touches at the outer standard deviation limits using directional diamond symbols to point out potential exhaustion zones.
4. Cumulative Volume Profile Distribution
Generates a horizontal volume distribution profile on the right side of the active regression window. High-volume nodes (HVNs) and low-volume nodes (LVNs) become visible along price levels.
5. Visual Trend Candles
Offers built-in background-aware candle painting that reflects the directional relationship relative to the regression baseline.
Settings Configuration
Regression Channel Settings
- Horizon & Deviation: Adjust regression lookback and standard deviation multiplier.
- Curve Model: Select between Linear and Polynomial fitting.
Inward Volume Settings
- Baseline & Height: Customize volume SMA lookback and ATR bar scaling.
- Flare Parameters: Adjust boundary zone percentage and volume multipliers.
Side Profile Settings
- Profile Bins: Adjust vertical price resolution rows.
- Horizontal Extent: Adjust maximum profile bar length.
Disclaimer
This tool is strictly designed for technical analysis and educational charting purposes. It does not constitute financial advice. Always employ risk management protocols.
Institutional Volume Profile Regression [Pro] combines polynomial curve fitting with structural volume distribution analysis to visualize dynamic order flow directly on the chart. It overlays inward volume pressure bars along standard deviation bounds and compiles an end-of-channel volume distribution profile.
Key Features
1. Polynomial Regression Channel Model
Computes a dynamic quadratic curve through matrix operations, creating an adaptive trend baseline that adjusts smoothly to medium-term volatility shifts without lagging.
2. Inward Dynamic Volume Pressure Bars
Renders directional buy and sell volume flow pointing inward from channel boundaries. Bullish accumulation builds from the lower band, while bearish distribution projects down from the upper band.
3. Boundary Volatility Contact Indicators
Marks first-contact touches at the outer standard deviation limits using directional diamond symbols to point out potential exhaustion zones.
4. Cumulative Volume Profile Distribution
Generates a horizontal volume distribution profile on the right side of the active regression window. High-volume nodes (HVNs) and low-volume nodes (LVNs) become visible along price levels.
5. Visual Trend Candles
Offers built-in background-aware candle painting that reflects the directional relationship relative to the regression baseline.
Settings Configuration
Regression Channel Settings
- Horizon & Deviation: Adjust regression lookback and standard deviation multiplier.
- Curve Model: Select between Linear and Polynomial fitting.
Inward Volume Settings
- Baseline & Height: Customize volume SMA lookback and ATR bar scaling.
- Flare Parameters: Adjust boundary zone percentage and volume multipliers.
Side Profile Settings
- Profile Bins: Adjust vertical price resolution rows.
- Horizontal Extent: Adjust maximum profile bar length.
Disclaimer
This tool is strictly designed for technical analysis and educational charting purposes. It does not constitute financial advice. Always employ risk management protocols.
Script de código abierto
Fiel al espíritu de TradingView, el creador de este script lo ha convertido en código abierto, para que los traders puedan revisar y verificar su funcionalidad. ¡Enhorabuena al autor! Aunque puede utilizarlo de forma gratuita, recuerde que cualquier republicación del código está sujeta a nuestras Normas internas.

Exención de responsabilidad
La información y las publicaciones no constituyen, ni deben considerarse como, asesoramiento o recomendaciones financieras, de inversión, de trading u otro tipo, proporcionadas o respaldadas por TradingView. Obtenga más información en Condiciones de uso.
Script de código abierto
Fiel al espíritu de TradingView, el creador de este script lo ha convertido en código abierto, para que los traders puedan revisar y verificar su funcionalidad. ¡Enhorabuena al autor! Aunque puede utilizarlo de forma gratuita, recuerde que cualquier republicación del código está sujeta a nuestras Normas internas.
Exención de responsabilidad
La información y las publicaciones no constituyen, ni deben considerarse como, asesoramiento o recomendaciones financieras, de inversión, de trading u otro tipo, proporcionadas o respaldadas por TradingView. Obtenga más información en Condiciones de uso.