OPEN-SOURCE SCRIPT
Actualizado HPDR Bands with projection
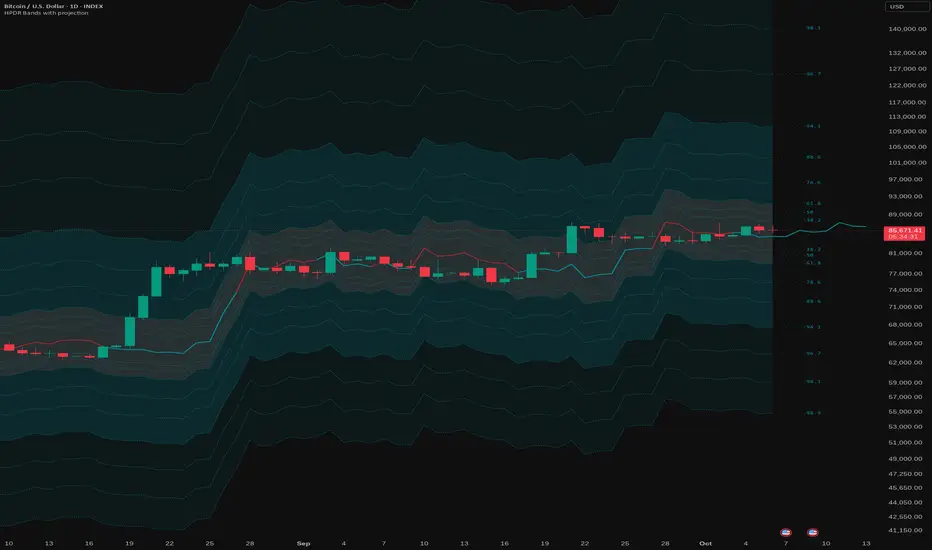
HPDR: Historical Price Delta Range
What is it? The HPDR indicator measures how much an asset’s price typically changes over a specific timeframe. It looks at historical price movements ("deltas") and organizes them into percentiles. These are then plotted on your chart as a median line surrounded by statistical bands.
This tool helps you understand an asset’s unique character and its typical price deviations.
Because the median is in this context a statistically relative stable value(if you add 7 values to 1000 it doesn't change much), it allows for high-probability projections of the future median.
For a clearer understanding of the indicator's logic, try setting the Range to 7 and the Offset to -7.
The 50% percentile Band signifies that in 50% of all bars, the price remained within this statistical range.
Notas de prensa
- Rolling Window – Improved and streamlined historical data handling
- Color Scheme – Updated colors with better compatibility for both light and dark themes
- Code Optimization – Simplified and optimized the calculation and overall code structure
Notas de prensa
better previewNotas de prensa
better previewScript de código abierto
Fiel al espíritu de TradingView, el creador de este script lo ha convertido en código abierto, para que los traders puedan revisar y verificar su funcionalidad. ¡Enhorabuena al autor! Aunque puede utilizarlo de forma gratuita, recuerde que cualquier republicación del código está sujeta a nuestras Normas internas.

Exención de responsabilidad
La información y las publicaciones no constituyen, ni deben considerarse como, asesoramiento o recomendaciones financieras, de inversión, de trading u otro tipo, proporcionadas o respaldadas por TradingView. Obtenga más información en Condiciones de uso.
Script de código abierto
Fiel al espíritu de TradingView, el creador de este script lo ha convertido en código abierto, para que los traders puedan revisar y verificar su funcionalidad. ¡Enhorabuena al autor! Aunque puede utilizarlo de forma gratuita, recuerde que cualquier republicación del código está sujeta a nuestras Normas internas.
Exención de responsabilidad
La información y las publicaciones no constituyen, ni deben considerarse como, asesoramiento o recomendaciones financieras, de inversión, de trading u otro tipo, proporcionadas o respaldadas por TradingView. Obtenga más información en Condiciones de uso.