OPEN-SOURCE SCRIPT
Range Compression Z-Score Research
Summary & Concept
Volatility is cyclical: prolonged compression inevitably precedes aggressive expansion.
Most traditional squeeze indicators (like Bollinger Band inside Keltner Channel squeezes) suffer from two fatal flaws:
They mistake quiet directional trends for consolidations (a stock grinding steadily higher with small candles often falsely looks like a squeeze).
They mistake erratic, single-day spike ranges for true bases (one volatile day followed by several inside days will distort traditional width calculations).
Range Compression Z-Score Research solves this quantitatively. It measures completed N-day price ranges against an extensive historical lookback (e.g., 252 trading days) using Percentile Ranking and Z-Scores, while enforcing strict mathematical sideways price action and daily range stability filters.
When all conditions align, it projects the exact consolidation box directly onto your price chart, identifies clear upper/lower trigger levels, and prints signals strictly on confirmed bar closes.
Key Features and How It Works
1. Statistical Volatility Rarity Engine
Percentile Rank: Measures where the current N-day high-low box ranks compared to all completed N-day windows over the historical sample (for example, a percentile of 5.0% or lower means the range is tighter than 95% of all prior windows).
Z-Score: Calculates how many standard deviations the current percentage range sits above or below the historical mean.
Dual Qualification Modes: Trigger on Percentile only, Z-Score only, or require both (AND / OR).
2. True Sideways Geometry Filter
Consolidations must actually be horizontal, not diagonal trends:
Net Drift / Box Ratio: Measures the absolute price change between the first close and last close divided by the total box height. If the market traveled directionally across the window, it is disqualified.
Linear Regression Slope %: Runs a least-squares linear regression line through closes within the window. Creeping uptrends or descending drift are eliminated.
3. Range Uniformity (Anti-Outlier Filter)
Coefficient of Variation (CV): Compares the standard deviation of individual daily ranges against the average daily range.
Single-Day Cap: Disqualifies fake bases where a single volatile session accounted for nearly the entire multi-day box height.
4. Confirmed Bar-Close Breakout Engine
Zero Wick Fakes: Breakouts and breakdowns require a confirmed candle close beyond the trigger level (close >= Upper Trigger or close <= Lower Trigger). Intraday wicks that poke beyond the line and reject will never trigger false signals.
Customizable Buffers: Add cushion to the breakout levels using an ATR fraction, fixed percentage, or tick count.
Volume Expansion Confirmation: Optional filter to require the breakout candle volume to exceed its 50-period SMA.
Chart and Visual Guide
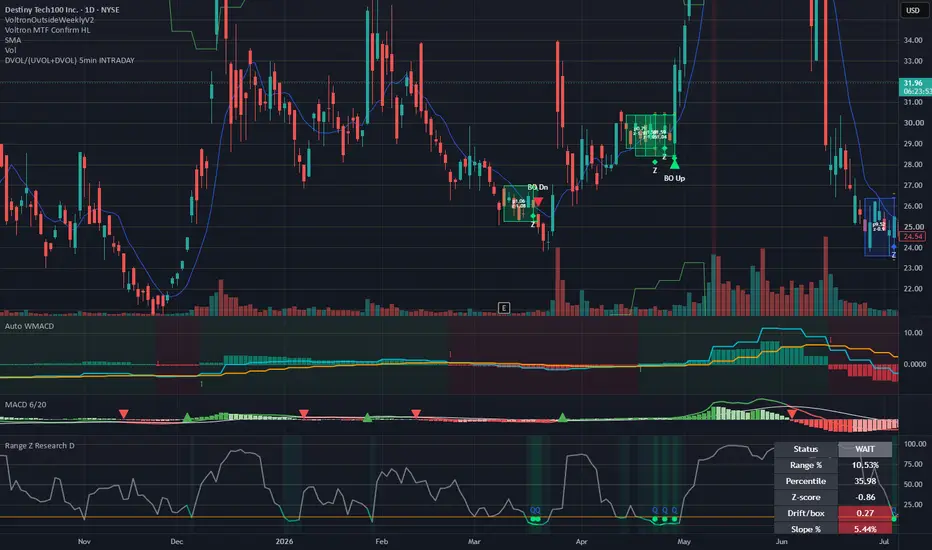
Lower Oscillator Pane
Green Line / Background: Range is statistically extreme and passes all sideways and stability filters (Qualified Setup).
Teal Line / Background: Range is statistically tight, but failed either the drift, slope, or consistency test (Tight Only).
Gray Line: Market is in normal or expanding volatility (Wait / Inactive).
Orange Line: Your extreme threshold level (for example, 10th percentile or -1.0 Z-score).
"Q" Circles: Marks bars where price is fully qualified for an impending expansion.
Main Price Chart
Color-Coded Compression Boxes: Automatically drawn around qualifying consolidation zones. Boxes are shaded based on rarity:
Lime Green: Extreme tightness (bottom 2% rarity or lower).
Teal: High tightness (bottom 5% rarity or lower).
Blue: Standard qualifying tightness (bottom 10% rarity or lower).
Box Labels: Displays the exact percentile (p) and Z-score (z) directly on the box.
Orange Trigger Lines: Real-time upper and lower breakout levels including your chosen buffer.
BO Up (Green Triangle): Confirmed upside candle close breakout.
BO Dn (Red Triangle): Confirmed downside candle close breakdown.
Real-Time Status Table (Top Right)
Displays live metrics for the current active setup:
Status: QUALIFIED, TIGHT ONLY, or WAIT.
Live Stats: Box Range %, Percentile, Z-Score, Drift Ratio, Regression Slope %, Range CV, and Breakout Trigger Levels.
Recommended Trading Workflow
Higher-Timeframe Compression: Use the default Daily research timeframe (D) to find coiled multi-day bases (for example, 5-day or 6-day consolidation).
Lower-Timeframe Execution: Place the indicator on an intraday execution chart (for example, 5-minute or 15-minute on SPY, QQQ, or major equities).
Wait for Qualification: Look for the lower pane to turn Green and the status table to show QUALIFIED.
Execute on Confirmed Close: Wait for a full candle close beyond the orange trigger line with the BO Up or BO Dn marker.
Volatility is cyclical: prolonged compression inevitably precedes aggressive expansion.
Most traditional squeeze indicators (like Bollinger Band inside Keltner Channel squeezes) suffer from two fatal flaws:
They mistake quiet directional trends for consolidations (a stock grinding steadily higher with small candles often falsely looks like a squeeze).
They mistake erratic, single-day spike ranges for true bases (one volatile day followed by several inside days will distort traditional width calculations).
Range Compression Z-Score Research solves this quantitatively. It measures completed N-day price ranges against an extensive historical lookback (e.g., 252 trading days) using Percentile Ranking and Z-Scores, while enforcing strict mathematical sideways price action and daily range stability filters.
When all conditions align, it projects the exact consolidation box directly onto your price chart, identifies clear upper/lower trigger levels, and prints signals strictly on confirmed bar closes.
Key Features and How It Works
1. Statistical Volatility Rarity Engine
Percentile Rank: Measures where the current N-day high-low box ranks compared to all completed N-day windows over the historical sample (for example, a percentile of 5.0% or lower means the range is tighter than 95% of all prior windows).
Z-Score: Calculates how many standard deviations the current percentage range sits above or below the historical mean.
Dual Qualification Modes: Trigger on Percentile only, Z-Score only, or require both (AND / OR).
2. True Sideways Geometry Filter
Consolidations must actually be horizontal, not diagonal trends:
Net Drift / Box Ratio: Measures the absolute price change between the first close and last close divided by the total box height. If the market traveled directionally across the window, it is disqualified.
Linear Regression Slope %: Runs a least-squares linear regression line through closes within the window. Creeping uptrends or descending drift are eliminated.
3. Range Uniformity (Anti-Outlier Filter)
Coefficient of Variation (CV): Compares the standard deviation of individual daily ranges against the average daily range.
Single-Day Cap: Disqualifies fake bases where a single volatile session accounted for nearly the entire multi-day box height.
4. Confirmed Bar-Close Breakout Engine
Zero Wick Fakes: Breakouts and breakdowns require a confirmed candle close beyond the trigger level (close >= Upper Trigger or close <= Lower Trigger). Intraday wicks that poke beyond the line and reject will never trigger false signals.
Customizable Buffers: Add cushion to the breakout levels using an ATR fraction, fixed percentage, or tick count.
Volume Expansion Confirmation: Optional filter to require the breakout candle volume to exceed its 50-period SMA.
Chart and Visual Guide
Lower Oscillator Pane
Green Line / Background: Range is statistically extreme and passes all sideways and stability filters (Qualified Setup).
Teal Line / Background: Range is statistically tight, but failed either the drift, slope, or consistency test (Tight Only).
Gray Line: Market is in normal or expanding volatility (Wait / Inactive).
Orange Line: Your extreme threshold level (for example, 10th percentile or -1.0 Z-score).
"Q" Circles: Marks bars where price is fully qualified for an impending expansion.
Main Price Chart
Color-Coded Compression Boxes: Automatically drawn around qualifying consolidation zones. Boxes are shaded based on rarity:
Lime Green: Extreme tightness (bottom 2% rarity or lower).
Teal: High tightness (bottom 5% rarity or lower).
Blue: Standard qualifying tightness (bottom 10% rarity or lower).
Box Labels: Displays the exact percentile (p) and Z-score (z) directly on the box.
Orange Trigger Lines: Real-time upper and lower breakout levels including your chosen buffer.
BO Up (Green Triangle): Confirmed upside candle close breakout.
BO Dn (Red Triangle): Confirmed downside candle close breakdown.
Real-Time Status Table (Top Right)
Displays live metrics for the current active setup:
Status: QUALIFIED, TIGHT ONLY, or WAIT.
Live Stats: Box Range %, Percentile, Z-Score, Drift Ratio, Regression Slope %, Range CV, and Breakout Trigger Levels.
Recommended Trading Workflow
Higher-Timeframe Compression: Use the default Daily research timeframe (D) to find coiled multi-day bases (for example, 5-day or 6-day consolidation).
Lower-Timeframe Execution: Place the indicator on an intraday execution chart (for example, 5-minute or 15-minute on SPY, QQQ, or major equities).
Wait for Qualification: Look for the lower pane to turn Green and the status table to show QUALIFIED.
Execute on Confirmed Close: Wait for a full candle close beyond the orange trigger line with the BO Up or BO Dn marker.
Script de código abierto
Fiel al espíritu de TradingView, el creador de este script lo ha convertido en código abierto, para que los traders puedan revisar y verificar su funcionalidad. ¡Enhorabuena al autor! Aunque puede utilizarlo de forma gratuita, recuerde que cualquier republicación del código está sujeta a nuestras Normas internas.

Exención de responsabilidad
La información y las publicaciones no constituyen, ni deben considerarse como, asesoramiento o recomendaciones financieras, de inversión, de trading u otro tipo, proporcionadas o respaldadas por TradingView. Obtenga más información en Condiciones de uso.
Script de código abierto
Fiel al espíritu de TradingView, el creador de este script lo ha convertido en código abierto, para que los traders puedan revisar y verificar su funcionalidad. ¡Enhorabuena al autor! Aunque puede utilizarlo de forma gratuita, recuerde que cualquier republicación del código está sujeta a nuestras Normas internas.
Exención de responsabilidad
La información y las publicaciones no constituyen, ni deben considerarse como, asesoramiento o recomendaciones financieras, de inversión, de trading u otro tipo, proporcionadas o respaldadas por TradingView. Obtenga más información en Condiciones de uso.