Value Area Acceptance Engine [PhenLabs]
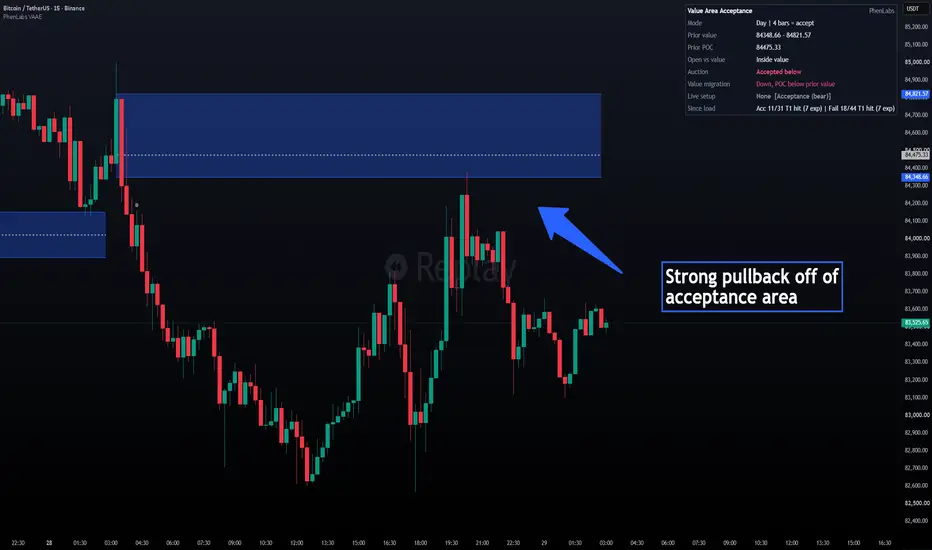
📊 Value Area Acceptance Engine [PhenLabs]
Version: PineScript™ v6
📌 Description
Value Area Acceptance Engine answers one question at the open of every session: is price being accepted outside yesterday’s value, or is the move a failed auction that will rotate back through it? It builds a time-at-price value area (VAL, VAH and POC) for each session, then watches how price behaves against the PRIOR session’s value using closed bars only.
Because the profile is built from time (how many bars traded at each price row) and not from volume, it works the same way on forex, indices, crypto, futures and stocks, and it works on every TradingView plan. No footprint data, no intrabar requests, no paid data feed.
When a setup appears the script marks it once, draws one clean trade plan (entry, stop, T1, T2) and tells you in the dashboard whether the setup is a TAKE or a SKIP based on how much room is left to the first target.
🚀 Points of Innovation
🔧 Core Components
🔥 Key Features
🎨 Visualization
📖 Usage Guidelines
Value Profile
Signals
Trade Plan
Display
Colors
✅ Best Use Cases
⚠️ Limitations
💡 What Makes This Unique
⚙️ Under the Hood
🔬 How It Works
Version: PineScript™ v6
📌 Description
Value Area Acceptance Engine answers one question at the open of every session: is price being accepted outside yesterday’s value, or is the move a failed auction that will rotate back through it? It builds a time-at-price value area (VAL, VAH and POC) for each session, then watches how price behaves against the PRIOR session’s value using closed bars only.
Because the profile is built from time (how many bars traded at each price row) and not from volume, it works the same way on forex, indices, crypto, futures and stocks, and it works on every TradingView plan. No footprint data, no intrabar requests, no paid data feed.
When a setup appears the script marks it once, draws one clean trade plan (entry, stop, T1, T2) and tells you in the dashboard whether the setup is a TAKE or a SKIP based on how much room is left to the first target.
🚀 Points of Innovation
- Acceptance is measured in TIME, not volume: price must keep closing outside the prior value area for a set number of minutes, automatically converted to bars on any chart timeframe
- Failed-auction detection: a short excursion outside prior value that closes back inside before acceptance is marked as a rotation setup back toward the POC and the opposite edge
- Value-migration gate: acceptance only fires when the developing POC has moved past the prior POC in the breakout direction
- TAKE / SKIP verdict on every setup, using distance to T1 measured in R, so late breakouts are flagged instead of chased
- Volume-free by design: works on symbols where volume is synthetic or missing, and on free plans
- Zero drawing objects for the levels: prior VAH, VAL and POC are plotted lines, so history stays light and always attached to price
🔧 Core Components
- Time-at-price profile: every confirmed bar adds one unit of time to each price row it touched. Rows are sliced from the previous session’s range, so the grid adapts to the instrument
- Value area engine: starting at the POC row, the area expands toward the heavier side until the chosen percentage of total time is covered
- Auction state machine: tracks probing, accepted and failed excursions above and below the prior value area, once per direction per session
- Trade plan builder: acceptance setups use the prior value edge and its width for stop and targets; failed-auction setups use the excursion extreme for the stop and the prior POC and opposite edge as targets
- Dashboard: one compact panel with mode, prior value, POC, open location, auction state, value migration, live setup and since-load T1 hit counts
🔥 Key Features
- Prior-session VAH, VAL and POC drawn as clean lines with a soft value-area fill, broken at each new session
- Two signal families: Acceptance (A) and Failed Auction (F), with bull and bear versions of each
- One live trade plan at a time, drawn with short lines so price stays readable
- SKIP setups are shown as small muted circles instead of full markers
- Six alert conditions: bullish, bearish, acceptance above, acceptance below, failed auction below, failed auction above
- Pine Screener compatible through three data-window plots
- Automatic period step-up (Day to Week to Month) when the chart timeframe is too coarse, with the active period shown in the dashboard
🎨 Visualization
- Grey-blue lines and fill: the prior value area. The dotted heavier line is the prior POC
- Teal triangle marked A below a bar: bullish acceptance. Pink triangle marked A above a bar: bearish acceptance
- Teal diamond marked F below a bar: bullish failed auction (rotation up). Pink diamond marked F above a bar: bearish failed auction (rotation down)
- Small muted circle: a signal that qualifies as SKIP because the reward to T1 is below your minimum R
- Dashed pink line: stop. Dashed teal line: T1. Dotted teal line: T2. Solid grey line: entry
- Optional histogram at the right edge: the developing time-at-price profile, with the value area and POC row shaded
📖 Usage Guidelines
Value Profile
- Profile period — Default: Day — Options: Day, Week, Month — Session used to build each value area. Steps up automatically if the chart timeframe is too coarse
- Value area % — Default: 70 — Range: 50-90 — Share of the session’s time-at-price that defines the value area
- Rows per prior range — Default: 40 — Range: 20-80 — Number of rows used to slice the previous session’s range. Higher gives a finer profile
Signals
- Acceptance time (minutes) — Default: 60 — Range: 10-480 — Time price must keep closing outside prior value to count as accepted. Converted to bars, minimum 2 bars
- Require value migration — Default: On — Acceptance fires only if the developing POC has passed the prior POC in the breakout direction. Turn off for earlier, more frequent acceptance signals
Trade Plan
- Show live trade plan — Default: On — Draws entry, stop, T1 and T2 for the active TAKE setup
- Min R to T1 for TAKE — Default: 1.0 — Range: 0.25-5.0 — Setups with less than this reward to T1 are marked SKIP. Only active while the trade plan is on
Display
- Prior value area and POC — Default: On — Shows the prior VAH, VAL, POC and fill
- Live time-at-price profile — Default: Off — Shows the developing profile histogram at the right edge
- Profile width (bars) — Default: 20 — Range: 8-60 — Width of the histogram. Only active while the profile is on
- Dashboard — Default: On — Shows the panel at top right
- Table size — Default: Small — Options: Tiny, Small, Normal — Dashboard text size
Colors
- Bull / Bear — Default: teal / pink — Signal, plan and dashboard colors
✅ Best Use Cases
- Deciding at the open whether a break of yesterday’s value is worth following or fading
- Filtering late breakouts with the TAKE / SKIP verdict
- Finding rotation trades back to the POC after a failed probe outside value
- Scanning a watchlist for symbols that are probing or accepted outside value with Pine Screener
- Instruments where volume is unreliable: forex, cash indices, some crypto pairs
⚠️ Limitations
- Built for intraday charts. If the chart timeframe is too coarse for the chosen period, the script steps up to a longer period. On weekly and higher charts it shows a notice instead of signals
- The first loaded session is partial, so no prior value area exists until the second session begins. Loaded history depth also limits the since-load counts
- A session with fewer than 8 bars produces no value area, so no signals follow it
- Time-at-price treats every bar equally. It does not know how much volume traded, only how long price spent at each level
- Price moving more than roughly 15 times the previous session’s range from the open compresses into edge rows
- The since-load T1 hit counts are descriptive and depend on how much history is loaded. They are not a backtest and not evidence of future results
💡 What Makes This Unique
- Time-based acceptance: most auction tools count volume or use a fixed opening window. This one asks how long price has actually been accepted outside value
- Acceptance and failure in one state machine: continuation and rotation setups come from the same prior value area, so you see both sides of the decision
- A verdict, not just a marker: every setup is graded TAKE or SKIP by its distance to T1 in R
- No plan gating: identical output on Basic, Essential, Plus, Premium and Ultimate
⚙️ Under the Hood
- Integer time-at-price array: a preallocated int array indexed by price row holds the developing profile. Each confirmed bar increments every row between its low and high, and the POC is updated incrementally with a nearest-to-close tie-break, so no per-bar full scan is needed
- Bounded value-area expansion: a pure function grows the area from the POC toward the heavier two-row side, with a hard loop bound and an early break once the target share is covered. It runs once per session, and once more on the last bar only when the optional histogram is on
- Time-to-bars conversion: timeframe.in_seconds() turns the acceptance minutes into a bar count on any chart timeframe, and timeframe.change() drives session boundaries for the selected period, so one setting behaves the same on 1 minute and 1 hour charts
- input.enum with active parameters: enum selectors for period and table size, and dependent inputs that gray out until their parent toggle is on, keep the panel to 14 inputs
- Confirmed-bar state machine: all state changes are gated with barstate.isconfirmed. There are no request.* calls, so there is no lookahead and no repaint. The prior levels are plotted as line-break plots, which keeps them attached to price and avoids drawing-object limits
- Data mode / plan note: nothing here is plan-gated. The only fallback is the automatic period step-up, and the dashboard Mode row shows the active period
- Screener and alerts: data-window plots Signal (1 acceptance up, -1 acceptance down, 2 failed auction below value, -2 failed auction above value), Auction state (2 or -2 accepted, 1 or -1 probing) and Distance to prior POC % can be used as Pine Screener columns. Six alertconditions cover bullish, bearish, acceptance and failed-auction events
🔬 How It Works
- Profile: at each session start the previous session is finalized into a value area (VAL, VAH) and POC, and a fresh time-at-price array is seeded using rows sized from the previous range
- Reference: the prior VAL, VAH and POC become the reference levels for the whole new session
- Track: each confirmed close counts as inside, above or below the prior value area. Consecutive closes outside build an excursion, and the highest or lowest point of the excursion is stored
- Accept: when an excursion reaches the acceptance time and value has migrated the same way, an Acceptance signal fires once for that direction
- Fail: when an excursion ends with a close back inside value before acceptance was reached, a Failed Auction signal fires once for the opposite direction
- Plan: the script builds entry, stop, T1 and T2, grades the setup TAKE or SKIP by distance to T1 in R, then follows it until stop, T2 or session end. If a bar touches both stop and target, the stop is assumed to hit first
💡 Note:
Signals appear on the bar that closes the condition and never move afterward. The dashboard reads from the last closed bar. Start with the defaults, then adjust acceptance time for your market: shorter for fast intraday charts, longer for slower ones. This tool is an analytical aid and is not financial advice. Always use your own risk management.

TradingView Charting w/ Crypto Systems: phenlabs.com
Join our growing community: discord.gg/phen
All content provided by PhenLabs is for informational & educational purposes only. Past performance does not guarantee future results.
Join our growing community: discord.gg/phen
All content provided by PhenLabs is for informational & educational purposes only. Past performance does not guarantee future results.
Exención de responsabilidad
La información y las publicaciones no constituyen, ni deben considerarse como, asesoramiento o recomendaciones financieras, de inversión, de trading u otro tipo, proporcionadas o respaldadas por TradingView. Obtenga más información en Condiciones de uso.
TradingView Charting w/ Crypto Systems: phenlabs.com
Join our growing community: discord.gg/phen
All content provided by PhenLabs is for informational & educational purposes only. Past performance does not guarantee future results.
Join our growing community: discord.gg/phen
All content provided by PhenLabs is for informational & educational purposes only. Past performance does not guarantee future results.
Exención de responsabilidad
La información y las publicaciones no constituyen, ni deben considerarse como, asesoramiento o recomendaciones financieras, de inversión, de trading u otro tipo, proporcionadas o respaldadas por TradingView. Obtenga más información en Condiciones de uso.