ICT AsianRange Midnight KZ ADR
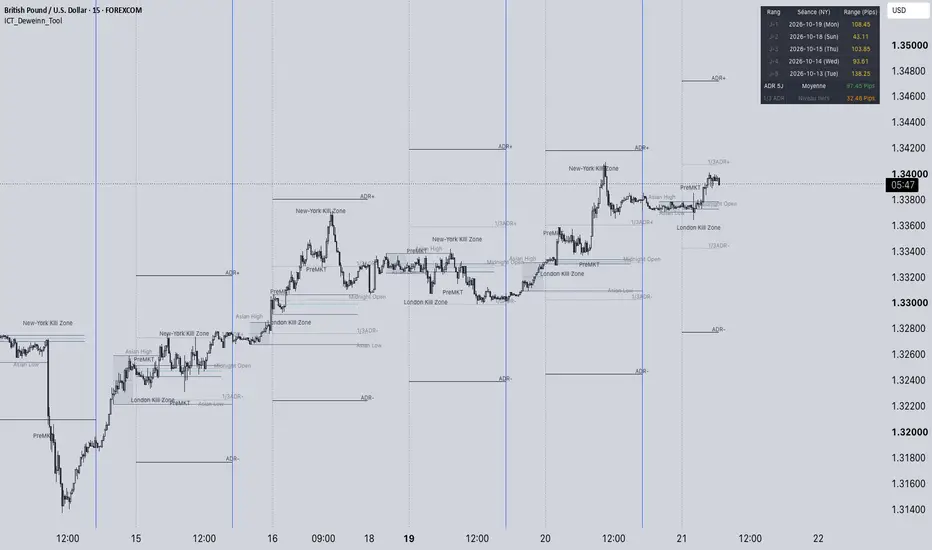
ICT Deweinn Tool — Sessions, Kill Zones & ADR
Description
ICT Deweinn Tool is a Pine Script v6 indicator designed to organize intraday price action around key trading sessions, session ranges and Average Daily Range (ADR) levels.
The objective is to provide a clearer view of the market's intraday structure and help traders identify relevant price levels, periods of activity and potential liquidity targets within an ICT (Inner Circle Trader) trading framework.
Rather than generating automatic buy or sell signals, this indicator provides contextual information to support discretionary market analysis.
Features
1. Asian Range
The indicator identifies the Asian session range and displays its high, low and midpoint.
Features include:
Asian High and Asian Low levels.
Range box and optional midpoint.
Extended range lines.
Independent high and low lines, with labels.
Tracking of whether the Asian High or Asian Low has been breached.
Historical display of up to five sessions for the independent Asian levels.
ICT application:
The Asian High and Asian Low can be monitored as potential liquidity pools. During London or New York, a trader can observe whether price reaches these levels, sweeps one side of the range or continues beyond it.
A sweep alone does not confirm a reversal. Additional price-action evidence is required.
2. Midnight Range
The indicator also plots the Midnight Range, with configurable session times, high and low levels, midpoint and optional extensions.
ICT application:
This range provides an additional intraday reference for studying price movement around midnight New York time. It can help contextualize subsequent price action and compare the position of price against earlier session levels.
3. London and New York Kill Zones
The indicator highlights configurable trading windows associated with London and New York.
Default settings:
London Kill Zone: 01:00–05:00 New York time.
London Pre-Market: 01:00–02:00 New York time.
New York Kill Zone: 07:00–10:00 New York time.
New York Pre-Market: 07:00–08:30 New York time.
The Kill Zone boxes are positioned above or below price using the session's high or low and configurable ATR-based offsets. Their height and appearance can be adjusted.
ICT application:
These time windows help traders focus on specific periods when they want to study liquidity sweeps, displacement, market structure shifts (MSS) and potential entry models.
The boxes mark time windows; they do not independently identify a valid ICT setup or guarantee increased volatility.
4. ADR — Average Daily Range
The indicator calculates the average of the previous daily high-low ranges, using a configurable period. The default is five days.
From the midnight opening price, it plots:
ADR+: Midnight Open + ADR.
ADR−: Midnight Open − ADR.
+1/3 ADR: Midnight Open + one-third of ADR.
−1/3 ADR: Midnight Open − one-third of ADR.
Midnight Open: The reference price for the daily projections.
The indicator also displays the historical daily ranges and the calculated ADR in an audit table.
The history display can be configured for:
Current day.
One week (five days).
One month (22 days).
ICT application:
ADR levels provide a framework for evaluating how far price has travelled relative to its recent average daily range.
They can be used to:
Establish potential intraday range objectives.
Assess whether price has already travelled a substantial distance.
Monitor reactions around projected range levels.
Compare price expansion with the location of external liquidity.
Add context to a possible continuation or retracement scenario.
The ±1/3 ADR levels provide intermediate references. They are not Fibonacci levels and should not be interpreted as automatic reversal zones.
An ADR projection is a reference based on historical range, not a prediction of the day's final high or low.
How to use it within an ICT workflow
A possible analysis sequence is:
1. Establish the context
Mark the Asian High and Asian Low, the Midnight Range and the Midnight Open.
2. Identify the relevant time window
Use the London and New York Kill Zones to focus on the period in which you intend to study price action.
3. Observe liquidity interactions
Monitor whether price approaches or sweeps a session high or low. Distinguish a liquidity sweep from a confirmed directional shift.
4. Evaluate displacement and structure
Look for additional confirmation through displacement, an MSS and a suitable entry model, according to your own ICT methodology.
5. Assess the daily range
Compare the current price with the ADR projections and intermediate one-third levels. Consider whether a projected target is compatible with the remaining price range and the broader market context.
6. Define risk independently
The indicator does not calculate position size, stop-loss placement or risk per trade. These must be determined separately.
Settings and compatibility
Pine Script version: v6.
Indicator overlay: displayed directly on the price chart.
Session timezone: America/New_York.
Session times, ADR period, history display and visual styles are configurable.
Intraday chart use is intended; the script includes a setting note recommending a 5-minute timeframe for correct time handling.
Important: Verify session alignment on your instrument and chart. New York daylight-saving changes and the exchange's own session schedule can affect the relationship between displayed times and the instrument's trading hours.
Limitations
ICT Deweinn Tool is a contextual analysis tool, not a complete trading system.
It does not automatically confirm liquidity manipulation, MSS, displacement, fair value gaps, optimal trade entry or directional bias. These concepts must be evaluated separately.
ADR levels and session ranges should be treated as analytical references rather than guaranteed support, resistance or price targets.
Description
ICT Deweinn Tool is a Pine Script v6 indicator designed to organize intraday price action around key trading sessions, session ranges and Average Daily Range (ADR) levels.
The objective is to provide a clearer view of the market's intraday structure and help traders identify relevant price levels, periods of activity and potential liquidity targets within an ICT (Inner Circle Trader) trading framework.
Rather than generating automatic buy or sell signals, this indicator provides contextual information to support discretionary market analysis.
Features
1. Asian Range
The indicator identifies the Asian session range and displays its high, low and midpoint.
Features include:
Asian High and Asian Low levels.
Range box and optional midpoint.
Extended range lines.
Independent high and low lines, with labels.
Tracking of whether the Asian High or Asian Low has been breached.
Historical display of up to five sessions for the independent Asian levels.
ICT application:
The Asian High and Asian Low can be monitored as potential liquidity pools. During London or New York, a trader can observe whether price reaches these levels, sweeps one side of the range or continues beyond it.
A sweep alone does not confirm a reversal. Additional price-action evidence is required.
2. Midnight Range
The indicator also plots the Midnight Range, with configurable session times, high and low levels, midpoint and optional extensions.
ICT application:
This range provides an additional intraday reference for studying price movement around midnight New York time. It can help contextualize subsequent price action and compare the position of price against earlier session levels.
3. London and New York Kill Zones
The indicator highlights configurable trading windows associated with London and New York.
Default settings:
London Kill Zone: 01:00–05:00 New York time.
London Pre-Market: 01:00–02:00 New York time.
New York Kill Zone: 07:00–10:00 New York time.
New York Pre-Market: 07:00–08:30 New York time.
The Kill Zone boxes are positioned above or below price using the session's high or low and configurable ATR-based offsets. Their height and appearance can be adjusted.
ICT application:
These time windows help traders focus on specific periods when they want to study liquidity sweeps, displacement, market structure shifts (MSS) and potential entry models.
The boxes mark time windows; they do not independently identify a valid ICT setup or guarantee increased volatility.
4. ADR — Average Daily Range
The indicator calculates the average of the previous daily high-low ranges, using a configurable period. The default is five days.
From the midnight opening price, it plots:
ADR+: Midnight Open + ADR.
ADR−: Midnight Open − ADR.
+1/3 ADR: Midnight Open + one-third of ADR.
−1/3 ADR: Midnight Open − one-third of ADR.
Midnight Open: The reference price for the daily projections.
The indicator also displays the historical daily ranges and the calculated ADR in an audit table.
The history display can be configured for:
Current day.
One week (five days).
One month (22 days).
ICT application:
ADR levels provide a framework for evaluating how far price has travelled relative to its recent average daily range.
They can be used to:
Establish potential intraday range objectives.
Assess whether price has already travelled a substantial distance.
Monitor reactions around projected range levels.
Compare price expansion with the location of external liquidity.
Add context to a possible continuation or retracement scenario.
The ±1/3 ADR levels provide intermediate references. They are not Fibonacci levels and should not be interpreted as automatic reversal zones.
An ADR projection is a reference based on historical range, not a prediction of the day's final high or low.
How to use it within an ICT workflow
A possible analysis sequence is:
1. Establish the context
Mark the Asian High and Asian Low, the Midnight Range and the Midnight Open.
2. Identify the relevant time window
Use the London and New York Kill Zones to focus on the period in which you intend to study price action.
3. Observe liquidity interactions
Monitor whether price approaches or sweeps a session high or low. Distinguish a liquidity sweep from a confirmed directional shift.
4. Evaluate displacement and structure
Look for additional confirmation through displacement, an MSS and a suitable entry model, according to your own ICT methodology.
5. Assess the daily range
Compare the current price with the ADR projections and intermediate one-third levels. Consider whether a projected target is compatible with the remaining price range and the broader market context.
6. Define risk independently
The indicator does not calculate position size, stop-loss placement or risk per trade. These must be determined separately.
Settings and compatibility
Pine Script version: v6.
Indicator overlay: displayed directly on the price chart.
Session timezone: America/New_York.
Session times, ADR period, history display and visual styles are configurable.
Intraday chart use is intended; the script includes a setting note recommending a 5-minute timeframe for correct time handling.
Important: Verify session alignment on your instrument and chart. New York daylight-saving changes and the exchange's own session schedule can affect the relationship between displayed times and the instrument's trading hours.
Limitations
ICT Deweinn Tool is a contextual analysis tool, not a complete trading system.
It does not automatically confirm liquidity manipulation, MSS, displacement, fair value gaps, optimal trade entry or directional bias. These concepts must be evaluated separately.
ADR levels and session ranges should be treated as analytical references rather than guaranteed support, resistance or price targets.

Exención de responsabilidad
La información y las publicaciones no constituyen, ni deben considerarse como, asesoramiento o recomendaciones financieras, de inversión, de trading u otro tipo, proporcionadas o respaldadas por TradingView. Obtenga más información en Condiciones de uso.
Exención de responsabilidad
La información y las publicaciones no constituyen, ni deben considerarse como, asesoramiento o recomendaciones financieras, de inversión, de trading u otro tipo, proporcionadas o respaldadas por TradingView. Obtenga más información en Condiciones de uso.