OPEN-SOURCE SCRIPT
20/200 Simple Moving Average
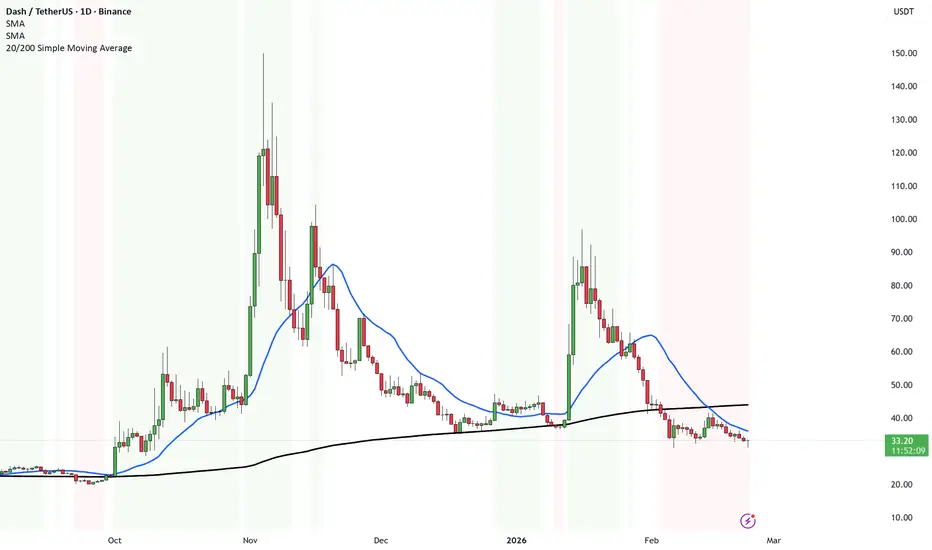
This indicator shows you the big trend vs the medium trend — and colors the chart so you don’t have to think too much.
Here’s what it does in simple terms:
What are the two lines?
20 SMA = the average price of the last 20 candles → short/medium-term direction.
200 SMA = the average price of the last 200 candles → long-term trend.
Think of it like:
20 = recent behavior.
200 = overall direction.
What the Background Colors Mean
🟢 Green Background
Price is ABOVE both the 20 and the 200.
That means:
Short-term trend is strong.
Long-term trend is bullish.
Market structure is healthy.
This is bullish territory.
🔴 Red Background
Price is BELOW both the 20 and the 200.
That means:
Short-term trend is weak.
Long-term trend is bearish.
Sellers are in control.
This is bearish territory.
⚪ White / No Color
Price is stuck between the two averages.
That means:
No clear trend.
Market is deciding.
Higher chance of chop.
Buy & Sell Signals (Crossovers)
Buy Territory:
When the 20 crosses ABOVE the 200 and price is already above the 200.
That’s momentum shifting bullish inside a confirmed trend.
Sell Territory:
When the 20 crosses BELOW the 200 and price is already below the 200.
That’s momentum turning bearish in a downtrend.
In very simple words:
Green = strong uptrend.
Red = strong downtrend.
White = messy middle.
Here’s what it does in simple terms:
What are the two lines?
20 SMA = the average price of the last 20 candles → short/medium-term direction.
200 SMA = the average price of the last 200 candles → long-term trend.
Think of it like:
20 = recent behavior.
200 = overall direction.
What the Background Colors Mean
🟢 Green Background
Price is ABOVE both the 20 and the 200.
That means:
Short-term trend is strong.
Long-term trend is bullish.
Market structure is healthy.
This is bullish territory.
🔴 Red Background
Price is BELOW both the 20 and the 200.
That means:
Short-term trend is weak.
Long-term trend is bearish.
Sellers are in control.
This is bearish territory.
⚪ White / No Color
Price is stuck between the two averages.
That means:
No clear trend.
Market is deciding.
Higher chance of chop.
Buy & Sell Signals (Crossovers)
Buy Territory:
When the 20 crosses ABOVE the 200 and price is already above the 200.
That’s momentum shifting bullish inside a confirmed trend.
Sell Territory:
When the 20 crosses BELOW the 200 and price is already below the 200.
That’s momentum turning bearish in a downtrend.
In very simple words:
Green = strong uptrend.
Red = strong downtrend.
White = messy middle.
Script de código abierto
Fiel al espíritu de TradingView, el creador de este script lo ha convertido en código abierto, para que los traders puedan revisar y verificar su funcionalidad. ¡Enhorabuena al autor! Aunque puede utilizarlo de forma gratuita, recuerde que cualquier republicación del código está sujeta a nuestras Normas internas.

🌐NEW Website 2025:
mati-trader.lovable.app/
✅ Facebook:
facebook.com/groups/matitrader
𝕏 (Formerly Twitter):
twitter.com/timonr
Trade Well,
Timon Rossolimos
Founder, MATI Trader
(Pro trader since 2003)
mati-trader.lovable.app/
✅ Facebook:
facebook.com/groups/matitrader
𝕏 (Formerly Twitter):
twitter.com/timonr
Trade Well,
Timon Rossolimos
Founder, MATI Trader
(Pro trader since 2003)
Exención de responsabilidad
La información y las publicaciones no constituyen, ni deben considerarse como, asesoramiento o recomendaciones financieras, de inversión, de trading u otro tipo, proporcionadas o respaldadas por TradingView. Obtenga más información en Condiciones de uso.
Script de código abierto
Fiel al espíritu de TradingView, el creador de este script lo ha convertido en código abierto, para que los traders puedan revisar y verificar su funcionalidad. ¡Enhorabuena al autor! Aunque puede utilizarlo de forma gratuita, recuerde que cualquier republicación del código está sujeta a nuestras Normas internas.
🌐NEW Website 2025:
mati-trader.lovable.app/
✅ Facebook:
facebook.com/groups/matitrader
𝕏 (Formerly Twitter):
twitter.com/timonr
Trade Well,
Timon Rossolimos
Founder, MATI Trader
(Pro trader since 2003)
mati-trader.lovable.app/
✅ Facebook:
facebook.com/groups/matitrader
𝕏 (Formerly Twitter):
twitter.com/timonr
Trade Well,
Timon Rossolimos
Founder, MATI Trader
(Pro trader since 2003)
Exención de responsabilidad
La información y las publicaciones no constituyen, ni deben considerarse como, asesoramiento o recomendaciones financieras, de inversión, de trading u otro tipo, proporcionadas o respaldadas por TradingView. Obtenga más información en Condiciones de uso.