OPEN-SOURCE SCRIPT
Actualizado SCOTTGO - Liquidity Zones (Sweeps + Tethers)
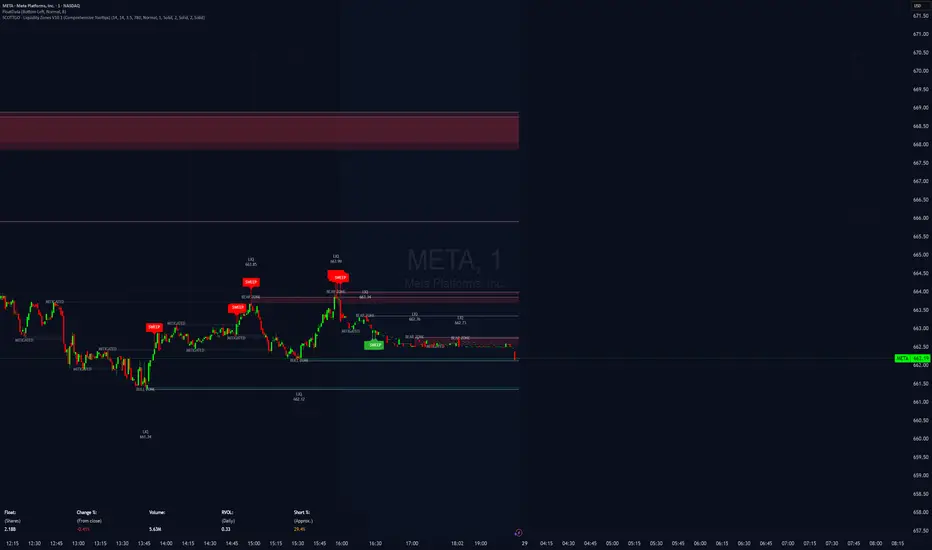
SCOTTGO - Liquidity Zones is a high-performance technical analysis tool designed to identify and track Institutional Liquidity Zones, Price Sweeps, and Pivot Levels with a clean, professional-grade interface.
Key Features
Dynamic Liquidity Zones: Automatically identifies Bullish and Bearish zones based on customizable pivot lookbacks.
Identify Liquidity Sweeps: Detects when price "pokes" through a zone but fails to close beyond it, marking the event with a distinct label and a visual tether line.
Active Tracking: Zones and LIQ lines track price in real-time until they are mitigated (broken by a candle close), at which point they visually "deactivate" to reduce clutter.
Professional UI: Features a compact, single-row styling menu (Color, Thickness, and Line Style) that mirrors TradingView’s native design.
Visual Elements
LIQ Lines: Solid or dashed lines tracking the exact pivot price within active zones.
Sweep Tethers: Vertical lines connecting the candle extreme to the "SWEEP" label for precise visual confirmation.
Detailed Tooltips: Hover over LIQ labels or Sweep tags to view specific price data and zone context.
Zone Titles: Clearly labeled "BULL ZONE" and "BEAR ZONE" tags with independent font size controls.
How to Use
Core Logic: Adjust the Pivot Lookback to define the strength of the levels you want to track.
Styling: Use the Inputs Tab for compact, specialized styling of Lines, Borders, and Sweeps.
Analysis: Look for "Sweeps" at zone boundaries as potential signs of reversal or stop-running.
Notas de prensa
SCOTTGO - Liquidity Zones (Sweeps + Tethers)Overview The SCOTTGO Liquidity Zones indicator is a high-performance technical analysis tool designed to identify significant institutional liquidity pools. It maps Buy-Side and Sell-Side liquidity based on structural pivot points, helping traders visualize where stop-losses are clustered and where "Smart Money" is likely to engage the market.
Key Features
Dynamic Liquidity Mapping: Automatically identifies and projects Bullish (Support) and Bearish (Resistance) zones based on user-defined pivot lookbacks.
Intraday Optimization: Includes a custom Bar Lookback Window to prevent historical clutter—perfect for 1m and 5m intraday traders who need a clean workspace.
Real-Time Sweep Detection: Visualizes liquidity "grabs" (Sweeps) with tethers and labels when price pierces a level but fails to close beyond it.
Comprehensive Metadata: Hover over any zone or label for detailed tooltips, including the exact price level, creation bar, and mitigation status.
Mitigation Logic: Zones automatically change color and state to "Mitigated" once price closes through the level, signaling a shift in market structure.
How to Use
Identify Zones: Look for price approaching the Bull/Bear boxes.
Monitor Sweeps: Watch for "SWEEP" labels which indicate a potential fake-out and high-probability reversal setup.
Check Mitigation: Use the grayed-out "Mitigated" zones to understand which previous levels have been cleared and are no longer active liquidity pools.
Settings
Pivot Lookback: Adjust for higher or lower sensitivity to market structure.
Lookback Period (Bars): Limit the indicator's memory to maintain chart clarity and performance.
Show Price (LIQ) Labels: Toggle price tags on/off to suit your visual preference.
Script de código abierto
Fiel al espíritu de TradingView, el creador de este script lo ha convertido en código abierto, para que los traders puedan revisar y verificar su funcionalidad. ¡Enhorabuena al autor! Aunque puede utilizarlo de forma gratuita, recuerde que cualquier republicación del código está sujeta a nuestras Normas internas.

Market Participant - Momentum Day Trader
Exención de responsabilidad
La información y las publicaciones no constituyen, ni deben considerarse como, asesoramiento o recomendaciones financieras, de inversión, de trading u otro tipo, proporcionadas o respaldadas por TradingView. Obtenga más información en Condiciones de uso.
Script de código abierto
Fiel al espíritu de TradingView, el creador de este script lo ha convertido en código abierto, para que los traders puedan revisar y verificar su funcionalidad. ¡Enhorabuena al autor! Aunque puede utilizarlo de forma gratuita, recuerde que cualquier republicación del código está sujeta a nuestras Normas internas.
Market Participant - Momentum Day Trader
Exención de responsabilidad
La información y las publicaciones no constituyen, ni deben considerarse como, asesoramiento o recomendaciones financieras, de inversión, de trading u otro tipo, proporcionadas o respaldadas por TradingView. Obtenga más información en Condiciones de uso.