Order Flow + Std Dev + IFVG + Quant + Delta + VWAP + VP + OTE
What this indicator does
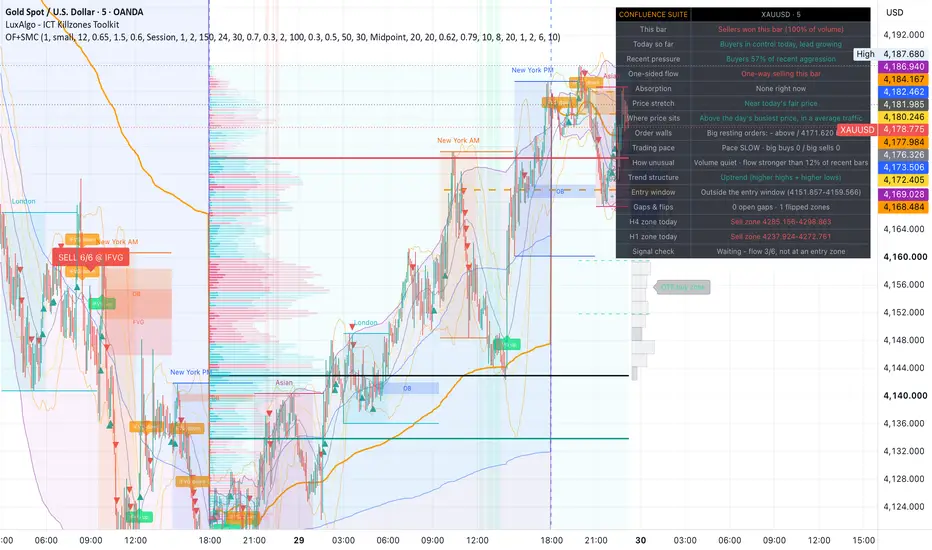
Orderflow Confluence Suite answers two questions on one chart: who is in control right now (orderflow) and is price at a location worth acting on (structure). It combines an intrabar orderflow engine — delta, cumulative delta, imbalance, absorption, VWAP with deviation bands, a rolling volume profile and a tape-speed readout — with a Smart Money Concepts location engine — fair value gaps with full inverse-FVG lifecycle, an Optimal Trade Entry retracement window built from swing structure, and the current day's H4 and H1 OTE zones projected onto your chart, resetting each new day.
A signal only prints when both sides agree: the orderflow score reaches its threshold (all six conditions by default) and price is sitting at a qualifying location — inside the OTE window, retesting a flipped gap, or inside today's H4/H1 zone — in the same direction. Each signal label states which location qualified.
The dashboard has a Plain English mode (on by default): every reading is written as a sentence — "Buyers in control today, lead growing", "Heavy selling absorbed — bullish clue", "Inside the pullback BUY window" — so you don't need to already speak orderflow to use it. Toggle it off for standard trader shorthand.
Why these components are combined
Orderflow tools tell you when participation is real but say nothing about where price is in the structure; SMC tools mark where the high-interest zones are but say nothing about whether anyone is actually trading there. Each half gates the other: the orderflow score filters out structure retests that nobody is participating in, and the location gate filters out strong flow that fires in the middle of nowhere. Neither module is decorative — every component feeds either the participation gate, the location gate, or the dashboard context that explains them.
How it works
Orderflow engine (participation gate). TradingView provides no Level 2 data, so aggressive buying and selling are reconstructed from lower-timeframe intrabar candles via request.security_lower_tf — an intrabar close at or above its open counts as aggressive buying, below as selling. From this: per-bar delta labels; session-anchored cumulative delta with rising/falling state; imbalance flags when one side takes ≥65% of a bar's volume (triangles on two consecutive bars); absorption diamonds when volume runs ≥1.5× average yet the bar's range stays ≤0.6× ATR with delta opposing the close — heavy aggression that failed to move price. A statistical layer normalises everything: volume z-score, delta z-score and delta percentile over a rolling window, plus a tape readout counting large prints (≥2× average print size) per side. Session VWAP carries ±1σ/±2σ bands from volume-weighted variance, and a rolling volume profile classifies the POC, high-volume nodes (≥70% of POC volume) and low-volume nodes (≤30%). The score counts six conditions per side: delta direction, CVD slope, price vs VWAP, price vs value, volume z-score above 0.5, and imbalance-or-absorption.
SMC engine (location gate). Fair value gaps are detected on the bar that completes them, with an ATR minimum-size filter. When price closes through a gap's midpoint (or full fill, selectable) it flips to an inverse FVG — former support becomes resistance and vice versa — and the script then watches for the retest: price tagging the flipped zone and closing back on the right side of it. Zones that get reclaimed are invalidated rather than left on the chart. The OTE window applies the 62–79% retracement (adjustable) to the most recent swing leg, with direction set by swing structure (higher highs and higher lows vs lower highs and lower lows) and an optional swing-order check. The same OTE calculation runs on the H4 and H1 series via request.security, and those zones are drawn as shaded boxes spanning the current day only — labelled buy or sell by that timeframe's structure — and reset automatically at the daily change. Optional SMA-based standard deviation bands are included for mean-reversion context (off by default; the dashboard reports SD position either way).
Signals. On a confirmed close, with a cooldown between signals: orderflow score ≥ threshold, dominant over the opposing side, and (unless the location gate is disabled) price at a same-direction location. Labels read like "BUY 6/6 @ H4 zone". Signals are evaluated on closed bars only and reference no future data, so they do not repaint; note the H4/H1 zones themselves update as those higher-timeframe bars develop, which is live structure behaving normally, and historical intrabar data can differ marginally from live-streamed ticks.
How to use it
Best on 5m–1h charts of liquid instruments with real exchange volume (index futures, gold, crypto). Set the intrabar timeframe to "1"; with seconds data on a 1–5m chart, 10S–15S gives finer delta. On forex/CFDs volume is tick count, so treat delta modules as rough approximations there.
Suggested flow: read the dashboard top-down — who's winning the bar and the session, whether flow is one-sided or being absorbed, how stretched price is, where it sits in the profile, then the structure/OTE/zone rows, ending with the Signal check row which states exactly what is and isn't satisfied. Treat the H4/H1 zones as the day's areas of interest, the OTE window as the tactical entry area, and wait for the two-gate signal rather than acting on either gate alone. Alerts are included for signals, absorption, stacked imbalance, IFVG retests and OTE entry.
Settings overview
Everything is grouped and toggleable: intrabar timeframe, imbalance/absorption thresholds, VWAP anchor and band widths, profile lookback/rows and node thresholds, FVG size/expiry/mitigation mode, OTE swing length and retracement bounds, HTF zone display, SD bands, minimum orderflow score, the location-gate toggle, and signal cooldown. Plain English mode is under General.
Limitations
Delta is reconstructed from intrabar candle direction — a well-established proxy, not true DOM/footprint data, which requires a dedicated platform with exchange depth. The confluence logic identifies conditions and locations, not outcomes; it is a context and filtering tool, not a trade system. Nothing here guarantees results — position sizing and stop discipline remain yours. This script is provided for educational purposes and is not financial advice.
Orderflow Confluence Suite answers two questions on one chart: who is in control right now (orderflow) and is price at a location worth acting on (structure). It combines an intrabar orderflow engine — delta, cumulative delta, imbalance, absorption, VWAP with deviation bands, a rolling volume profile and a tape-speed readout — with a Smart Money Concepts location engine — fair value gaps with full inverse-FVG lifecycle, an Optimal Trade Entry retracement window built from swing structure, and the current day's H4 and H1 OTE zones projected onto your chart, resetting each new day.
A signal only prints when both sides agree: the orderflow score reaches its threshold (all six conditions by default) and price is sitting at a qualifying location — inside the OTE window, retesting a flipped gap, or inside today's H4/H1 zone — in the same direction. Each signal label states which location qualified.
The dashboard has a Plain English mode (on by default): every reading is written as a sentence — "Buyers in control today, lead growing", "Heavy selling absorbed — bullish clue", "Inside the pullback BUY window" — so you don't need to already speak orderflow to use it. Toggle it off for standard trader shorthand.
Why these components are combined
Orderflow tools tell you when participation is real but say nothing about where price is in the structure; SMC tools mark where the high-interest zones are but say nothing about whether anyone is actually trading there. Each half gates the other: the orderflow score filters out structure retests that nobody is participating in, and the location gate filters out strong flow that fires in the middle of nowhere. Neither module is decorative — every component feeds either the participation gate, the location gate, or the dashboard context that explains them.
How it works
Orderflow engine (participation gate). TradingView provides no Level 2 data, so aggressive buying and selling are reconstructed from lower-timeframe intrabar candles via request.security_lower_tf — an intrabar close at or above its open counts as aggressive buying, below as selling. From this: per-bar delta labels; session-anchored cumulative delta with rising/falling state; imbalance flags when one side takes ≥65% of a bar's volume (triangles on two consecutive bars); absorption diamonds when volume runs ≥1.5× average yet the bar's range stays ≤0.6× ATR with delta opposing the close — heavy aggression that failed to move price. A statistical layer normalises everything: volume z-score, delta z-score and delta percentile over a rolling window, plus a tape readout counting large prints (≥2× average print size) per side. Session VWAP carries ±1σ/±2σ bands from volume-weighted variance, and a rolling volume profile classifies the POC, high-volume nodes (≥70% of POC volume) and low-volume nodes (≤30%). The score counts six conditions per side: delta direction, CVD slope, price vs VWAP, price vs value, volume z-score above 0.5, and imbalance-or-absorption.
SMC engine (location gate). Fair value gaps are detected on the bar that completes them, with an ATR minimum-size filter. When price closes through a gap's midpoint (or full fill, selectable) it flips to an inverse FVG — former support becomes resistance and vice versa — and the script then watches for the retest: price tagging the flipped zone and closing back on the right side of it. Zones that get reclaimed are invalidated rather than left on the chart. The OTE window applies the 62–79% retracement (adjustable) to the most recent swing leg, with direction set by swing structure (higher highs and higher lows vs lower highs and lower lows) and an optional swing-order check. The same OTE calculation runs on the H4 and H1 series via request.security, and those zones are drawn as shaded boxes spanning the current day only — labelled buy or sell by that timeframe's structure — and reset automatically at the daily change. Optional SMA-based standard deviation bands are included for mean-reversion context (off by default; the dashboard reports SD position either way).
Signals. On a confirmed close, with a cooldown between signals: orderflow score ≥ threshold, dominant over the opposing side, and (unless the location gate is disabled) price at a same-direction location. Labels read like "BUY 6/6 @ H4 zone". Signals are evaluated on closed bars only and reference no future data, so they do not repaint; note the H4/H1 zones themselves update as those higher-timeframe bars develop, which is live structure behaving normally, and historical intrabar data can differ marginally from live-streamed ticks.
How to use it
Best on 5m–1h charts of liquid instruments with real exchange volume (index futures, gold, crypto). Set the intrabar timeframe to "1"; with seconds data on a 1–5m chart, 10S–15S gives finer delta. On forex/CFDs volume is tick count, so treat delta modules as rough approximations there.
Suggested flow: read the dashboard top-down — who's winning the bar and the session, whether flow is one-sided or being absorbed, how stretched price is, where it sits in the profile, then the structure/OTE/zone rows, ending with the Signal check row which states exactly what is and isn't satisfied. Treat the H4/H1 zones as the day's areas of interest, the OTE window as the tactical entry area, and wait for the two-gate signal rather than acting on either gate alone. Alerts are included for signals, absorption, stacked imbalance, IFVG retests and OTE entry.
Settings overview
Everything is grouped and toggleable: intrabar timeframe, imbalance/absorption thresholds, VWAP anchor and band widths, profile lookback/rows and node thresholds, FVG size/expiry/mitigation mode, OTE swing length and retracement bounds, HTF zone display, SD bands, minimum orderflow score, the location-gate toggle, and signal cooldown. Plain English mode is under General.
Limitations
Delta is reconstructed from intrabar candle direction — a well-established proxy, not true DOM/footprint data, which requires a dedicated platform with exchange depth. The confluence logic identifies conditions and locations, not outcomes; it is a context and filtering tool, not a trade system. Nothing here guarantees results — position sizing and stop discipline remain yours. This script is provided for educational purposes and is not financial advice.

Exención de responsabilidad
La información y las publicaciones no constituyen, ni deben considerarse como, asesoramiento o recomendaciones financieras, de inversión, de trading u otro tipo, proporcionadas o respaldadas por TradingView. Obtenga más información en Condiciones de uso.
Exención de responsabilidad
La información y las publicaciones no constituyen, ni deben considerarse como, asesoramiento o recomendaciones financieras, de inversión, de trading u otro tipo, proporcionadas o respaldadas por TradingView. Obtenga más información en Condiciones de uso.