OPEN-SOURCE SCRIPT
Mag7 + SPY Multi-Decade Seasonality
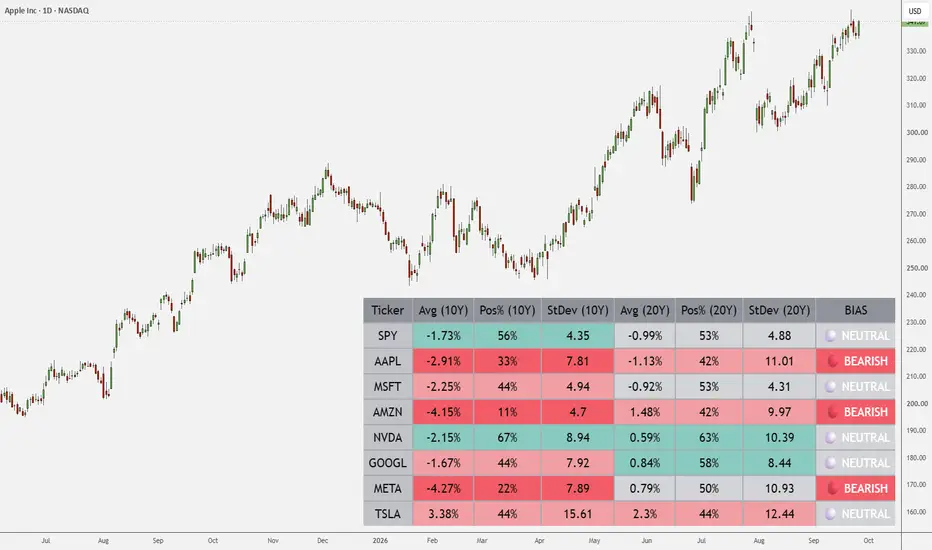
📊 Overview
The Mag7 + SPY Seasonal Dashboard tracks historical monthly seasonality across the Magnificent 7 (AAPL, MSFT, AMZN, NVDA, GOOGL, META, TSLA) and the SPY benchmark.
It dynamically pulls monthly timeframe data (1M) for the current calendar month and calculates multi-period historical metrics over 10-Year and 20-Year lookback windows.
⚙️ Key Tracked Metrics:
- Avg Return (Avg): Average historical percentage return for the current calendar month.
- Win Rate (Pos%): Percentage of historical years where the current month closed positive.
- Volatility (StDev): Standard deviation of historical monthly returns for dispersion analysis.
- Institutional BIAS:
🟢 BULLISH: Pos% (10Y) $\ge$ 70% AND Pos% (20Y) $\ge$ 60%.
🔴 BEARISH: Pos% (10Y) $\le$ 40% OR Pos% (20Y) $\le$ 40%.
⚪ NEUTRAL: Mixed or balanced historical performance.
🎯 How to Use:
- Apply the indicator overlay to any chart (the dashboard uses fixed 1M security requests, so chart timeframe won't alter the table).
- Scan the BIAS column for strong cross-period alignment between the 10-year and 20-year windows.
- Combine directional seasonal bias with technical market structure and intraday execution triggers.
The Mag7 + SPY Seasonal Dashboard tracks historical monthly seasonality across the Magnificent 7 (AAPL, MSFT, AMZN, NVDA, GOOGL, META, TSLA) and the SPY benchmark.
It dynamically pulls monthly timeframe data (1M) for the current calendar month and calculates multi-period historical metrics over 10-Year and 20-Year lookback windows.
⚙️ Key Tracked Metrics:
- Avg Return (Avg): Average historical percentage return for the current calendar month.
- Win Rate (Pos%): Percentage of historical years where the current month closed positive.
- Volatility (StDev): Standard deviation of historical monthly returns for dispersion analysis.
- Institutional BIAS:
🟢 BULLISH: Pos% (10Y) $\ge$ 70% AND Pos% (20Y) $\ge$ 60%.
🔴 BEARISH: Pos% (10Y) $\le$ 40% OR Pos% (20Y) $\le$ 40%.
⚪ NEUTRAL: Mixed or balanced historical performance.
🎯 How to Use:
- Apply the indicator overlay to any chart (the dashboard uses fixed 1M security requests, so chart timeframe won't alter the table).
- Scan the BIAS column for strong cross-period alignment between the 10-year and 20-year windows.
- Combine directional seasonal bias with technical market structure and intraday execution triggers.
Script de código abierto
Fiel al espíritu de TradingView, el creador de este script lo ha convertido en código abierto, para que los traders puedan revisar y verificar su funcionalidad. ¡Enhorabuena al autor! Aunque puede utilizarlo de forma gratuita, recuerde que cualquier republicación del código está sujeta a nuestras Normas internas.

Exención de responsabilidad
La información y las publicaciones no constituyen, ni deben considerarse como, asesoramiento o recomendaciones financieras, de inversión, de trading u otro tipo, proporcionadas o respaldadas por TradingView. Obtenga más información en Condiciones de uso.
Script de código abierto
Fiel al espíritu de TradingView, el creador de este script lo ha convertido en código abierto, para que los traders puedan revisar y verificar su funcionalidad. ¡Enhorabuena al autor! Aunque puede utilizarlo de forma gratuita, recuerde que cualquier republicación del código está sujeta a nuestras Normas internas.
Exención de responsabilidad
La información y las publicaciones no constituyen, ni deben considerarse como, asesoramiento o recomendaciones financieras, de inversión, de trading u otro tipo, proporcionadas o respaldadas por TradingView. Obtenga más información en Condiciones de uso.