Anchored RWAP
An anchored average promises to remember where an auction began. A recency-weighted average quietly breaks that promise, because it forgets its oldest bars geometrically, and the forgetting runs at a different speed on every chart clock. An anchor that still governs a daily line can be long forgotten on the hourly chart of the same symbol, while both lines continue to wear the word "anchored." Anchored RWAP keeps the anchor, keeps the forgetting, and prints exactly how much of the anchor each clock still remembers.
The indicator is a supplementary instrument. It does not issue entries or exits; it describes where recent prices have settled since a chosen event, whether that equilibrium is migrating, and whether the event still shapes the line. A trader can use those readings to test an existing setup, to manage an open position, or to match an option's horizon to the market's own memory. The sections below explain the calculation, read the chart above, and show how to fold the readings into analysis already in hand.
The Calculation Forgets on Purpose
Anchored RWAP takes a finite geometric average of a chosen price source, beginning at a defined anchor. The current bar receives a weight of one, and each earlier bar receives the prior weight multiplied by a decay factor called gamma. No bar before the anchor contributes, so the line belongs to one auction rather than to the whole chart.
The anchor can be set four ways. Manual mode begins on the first bar at or after a chosen timestamp, which suits swings, breakouts, failed auctions and scheduled releases. Session, Week and Month modes reset at their calendar boundaries for traders who study recurring auctions. An optional cap limits the calculation to a maximum number of bars, and an optional sigma row measures price's distance from the line in the line's own recency-weighted dispersion.
The difference from familiar averages lies in origin and decay together. VWAP weights by volume and never forgets a heavy print while its anchor stands. An EMA forgets smoothly but has no origin, and an SMA has a window but drops each bar from full weight to zero in one step. Anchored RWAP joins a visible origin to a smooth fade, so a reader can see both where the auction started and how far its memory has drifted from that start.
One Memory Across Three Clocks
The indicator was built for the 15-minute, hourly and daily charts, and its default memory mode makes those three clocks agree. Clock span mode sets memory in trading days rather than in bars. The default of 34 trading days places roughly 95 percent of the weight on the latest 34 sessions, whatever the chart's timeframe. Gamma is then derived for each clock, so one anchor means the same thing on all three.
An intraday chart measures its own trading day as the median bar count of its 21 most recent completed days. The median behaves like a jury that ignores its loudest member, so half-days, merged holiday sessions and sparse extended-hours days cannot distort it. Regular-hours equities measure seven hourly bars, extended hours measure whatever actually prints, and 24-hour markets measure twenty-four. The chart's session setting therefore changes the bar count without changing the memory in days, and the line lands in nearly the same place either way.
A row called Anchor reach divides the bars since the anchor by the full memory. A ratio at or below 1.0 reads Active, up to 2.0 reads Fading, and beyond that reads Forgotten, meaning the line has become a rolling average that no longer depends on its anchor. Under Clock span, one anchor prints the same reach on every clock, which makes the row a calibration check as well as a reading. Fixed gamma mode remains available for traders who want a fast intraday line and accept that the anchor will matter less on faster clocks.
Reading the Chart
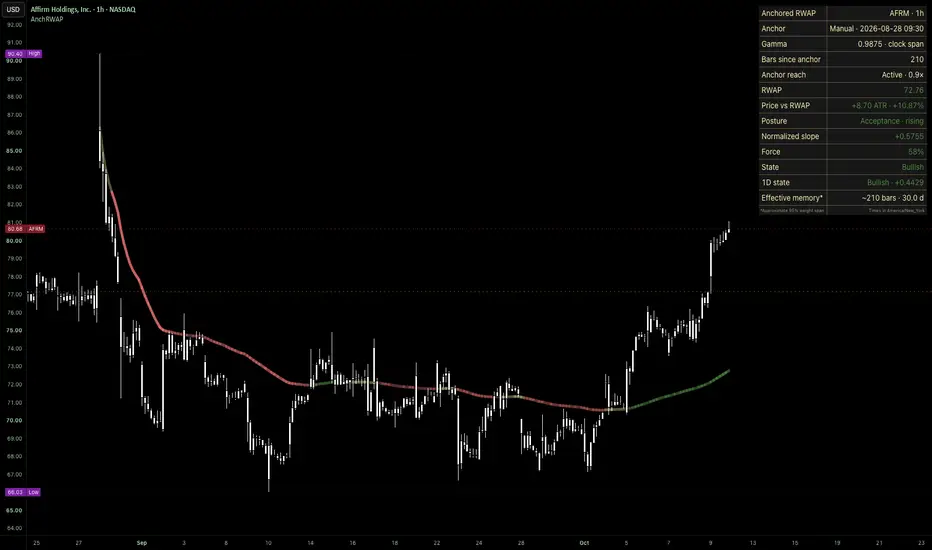
The chart above shows Affirm (AFRM) on the hourly clock with regular hours, captured after the close of 9 October. The manual anchor sits at the 28 August session that printed the 90.40 high. The line's path tells that story in three hues. It falls in red as price unwinds the spike toward the 66.03 low of 10 September, flattens through late September while price rotates on both sides of a line near 72, and turns green in early October as price pulls away from the line.
The table carries the numbers. Gamma reads 0.9875, the anchor stands 210 bars back, and the reach reads Active at 0.9×, which matches the daily chart's reach for the same anchor. The RWAP stands at 72.76 with price at 80.68, so price sits 8.70 ATR and 10.87 percent above the line. The posture reads Acceptance · rising, the normalized slope reads +0.5755 with 58 percent force, and the daily ladder row reads Bullish at +0.4429.
Hue carries direction, and brightness carries force. The slope is the change in the line across five bars divided by a 13-bar ATR, and a threshold with hysteresis keeps minor wobbles from flipping the hue. Brightness rises with the slope's magnitude, so a dimming bullish line still rises, only more slowly. Hue is the weathervane and brightness the anemometer, and neither one claims to know where the storm will land.
The posture row joins location to state. Price above a rising line reads as acceptance, price beneath a rising line reads as a pullback, and the mirror readings apply to a falling line. Price within a narrow band around the line reads as equilibrium. Every value also appears in the Data Window, including the measured bars per trading day, so a reader can quote numbers that a screenshot might clip.
Where Anchored RWAP Fits in a Trading Process
The primary use is analysis that a trader already performs. A setup drawn from structure, volume or momentum can be checked against the line: a long entry in Acceptance · rising has equilibrium behind it, while the same entry in Relief · falling is a trade against a line that has not changed its mind. A pullback into a rising line with the ladder in agreement describes a with-trend context, and a breakout that leaves a neutral line far behind describes price outrunning acceptance. The line supplies context for a decision, and the decision belongs to the trader's own method.
The second use is trade management. An open position can be monitored by watching posture and force rather than price alone, since a dimming line warns of deceleration before a reversal becomes visible in the candles. A re-anchor at a new structural event isolates the auction in which a trade actually lives. The ladder rows on the 15-minute and hourly charts report the slower clocks from their last closed bars, so those values never repaint while a position is open.
The third use belongs to options traders, who face a calendar question every time they choose an expiration. A daily line with a 34-day memory weights roughly the same stretch of trading that a 45-day option must endure. A same-day option belongs to a single session, and a session-anchored 15-minute line describes that session's own equilibrium. The memory span becomes a setting that can be matched to the exposure.
The indicator reads price alone. It does not measure volume, order flow, open interest, implied volatility or dealer positioning, and its gamma is a decay coefficient with no connection to options gamma. Charts below 15 minutes turn acceptance into noise, so a design-clock guard hides the line on other timeframes and says why in the table. A chart whose history begins on the anchor's own day uses a provisional gamma until it has measured one full trading day, and the table marks that state openly. Nothing in this description or in the script is financial advice, and past behavior of the line does not predict future prices.
Memory Is the Trade's Horizon
Every average on a chart carries a memory, and that memory is usually an accident of the timeframe the trader happened to open. A hundred bars means a season on one clock and an afternoon on another, and the line never says which. Anchored RWAP converts that accident into a declared number of trading days and prints it beside every reading.
The consequence reaches past the indicator. An option is a lease on the future, and the memory span is the tenant history checked before signing. A one-session lease judged on a 34-day history mistakes the tenant for the neighborhood, and a 45-day lease judged on a 36-minute history mistakes a single visit for a reputation. The effective-memory row states, in bars and trading days, which history the line is reading. A trade and the evidence behind it each run on a calendar. The table has always printed one of them, and the trader has always chosen the other.
The indicator is a supplementary instrument. It does not issue entries or exits; it describes where recent prices have settled since a chosen event, whether that equilibrium is migrating, and whether the event still shapes the line. A trader can use those readings to test an existing setup, to manage an open position, or to match an option's horizon to the market's own memory. The sections below explain the calculation, read the chart above, and show how to fold the readings into analysis already in hand.
The Calculation Forgets on Purpose
Anchored RWAP takes a finite geometric average of a chosen price source, beginning at a defined anchor. The current bar receives a weight of one, and each earlier bar receives the prior weight multiplied by a decay factor called gamma. No bar before the anchor contributes, so the line belongs to one auction rather than to the whole chart.
The anchor can be set four ways. Manual mode begins on the first bar at or after a chosen timestamp, which suits swings, breakouts, failed auctions and scheduled releases. Session, Week and Month modes reset at their calendar boundaries for traders who study recurring auctions. An optional cap limits the calculation to a maximum number of bars, and an optional sigma row measures price's distance from the line in the line's own recency-weighted dispersion.
The difference from familiar averages lies in origin and decay together. VWAP weights by volume and never forgets a heavy print while its anchor stands. An EMA forgets smoothly but has no origin, and an SMA has a window but drops each bar from full weight to zero in one step. Anchored RWAP joins a visible origin to a smooth fade, so a reader can see both where the auction started and how far its memory has drifted from that start.
One Memory Across Three Clocks
The indicator was built for the 15-minute, hourly and daily charts, and its default memory mode makes those three clocks agree. Clock span mode sets memory in trading days rather than in bars. The default of 34 trading days places roughly 95 percent of the weight on the latest 34 sessions, whatever the chart's timeframe. Gamma is then derived for each clock, so one anchor means the same thing on all three.
An intraday chart measures its own trading day as the median bar count of its 21 most recent completed days. The median behaves like a jury that ignores its loudest member, so half-days, merged holiday sessions and sparse extended-hours days cannot distort it. Regular-hours equities measure seven hourly bars, extended hours measure whatever actually prints, and 24-hour markets measure twenty-four. The chart's session setting therefore changes the bar count without changing the memory in days, and the line lands in nearly the same place either way.
A row called Anchor reach divides the bars since the anchor by the full memory. A ratio at or below 1.0 reads Active, up to 2.0 reads Fading, and beyond that reads Forgotten, meaning the line has become a rolling average that no longer depends on its anchor. Under Clock span, one anchor prints the same reach on every clock, which makes the row a calibration check as well as a reading. Fixed gamma mode remains available for traders who want a fast intraday line and accept that the anchor will matter less on faster clocks.
Reading the Chart
The chart above shows Affirm (AFRM) on the hourly clock with regular hours, captured after the close of 9 October. The manual anchor sits at the 28 August session that printed the 90.40 high. The line's path tells that story in three hues. It falls in red as price unwinds the spike toward the 66.03 low of 10 September, flattens through late September while price rotates on both sides of a line near 72, and turns green in early October as price pulls away from the line.
The table carries the numbers. Gamma reads 0.9875, the anchor stands 210 bars back, and the reach reads Active at 0.9×, which matches the daily chart's reach for the same anchor. The RWAP stands at 72.76 with price at 80.68, so price sits 8.70 ATR and 10.87 percent above the line. The posture reads Acceptance · rising, the normalized slope reads +0.5755 with 58 percent force, and the daily ladder row reads Bullish at +0.4429.
Hue carries direction, and brightness carries force. The slope is the change in the line across five bars divided by a 13-bar ATR, and a threshold with hysteresis keeps minor wobbles from flipping the hue. Brightness rises with the slope's magnitude, so a dimming bullish line still rises, only more slowly. Hue is the weathervane and brightness the anemometer, and neither one claims to know where the storm will land.
The posture row joins location to state. Price above a rising line reads as acceptance, price beneath a rising line reads as a pullback, and the mirror readings apply to a falling line. Price within a narrow band around the line reads as equilibrium. Every value also appears in the Data Window, including the measured bars per trading day, so a reader can quote numbers that a screenshot might clip.
Where Anchored RWAP Fits in a Trading Process
The primary use is analysis that a trader already performs. A setup drawn from structure, volume or momentum can be checked against the line: a long entry in Acceptance · rising has equilibrium behind it, while the same entry in Relief · falling is a trade against a line that has not changed its mind. A pullback into a rising line with the ladder in agreement describes a with-trend context, and a breakout that leaves a neutral line far behind describes price outrunning acceptance. The line supplies context for a decision, and the decision belongs to the trader's own method.
The second use is trade management. An open position can be monitored by watching posture and force rather than price alone, since a dimming line warns of deceleration before a reversal becomes visible in the candles. A re-anchor at a new structural event isolates the auction in which a trade actually lives. The ladder rows on the 15-minute and hourly charts report the slower clocks from their last closed bars, so those values never repaint while a position is open.
The third use belongs to options traders, who face a calendar question every time they choose an expiration. A daily line with a 34-day memory weights roughly the same stretch of trading that a 45-day option must endure. A same-day option belongs to a single session, and a session-anchored 15-minute line describes that session's own equilibrium. The memory span becomes a setting that can be matched to the exposure.
The indicator reads price alone. It does not measure volume, order flow, open interest, implied volatility or dealer positioning, and its gamma is a decay coefficient with no connection to options gamma. Charts below 15 minutes turn acceptance into noise, so a design-clock guard hides the line on other timeframes and says why in the table. A chart whose history begins on the anchor's own day uses a provisional gamma until it has measured one full trading day, and the table marks that state openly. Nothing in this description or in the script is financial advice, and past behavior of the line does not predict future prices.
Memory Is the Trade's Horizon
Every average on a chart carries a memory, and that memory is usually an accident of the timeframe the trader happened to open. A hundred bars means a season on one clock and an afternoon on another, and the line never says which. Anchored RWAP converts that accident into a declared number of trading days and prints it beside every reading.
The consequence reaches past the indicator. An option is a lease on the future, and the memory span is the tenant history checked before signing. A one-session lease judged on a 34-day history mistakes the tenant for the neighborhood, and a 45-day lease judged on a 36-minute history mistakes a single visit for a reputation. The effective-memory row states, in bars and trading days, which history the line is reading. A trade and the evidence behind it each run on a calendar. The table has always printed one of them, and the trader has always chosen the other.

adrian dyer
Exención de responsabilidad
La información y las publicaciones no constituyen, ni deben considerarse como, asesoramiento o recomendaciones financieras, de inversión, de trading u otro tipo, proporcionadas o respaldadas por TradingView. Obtenga más información en Condiciones de uso.
adrian dyer
Exención de responsabilidad
La información y las publicaciones no constituyen, ni deben considerarse como, asesoramiento o recomendaciones financieras, de inversión, de trading u otro tipo, proporcionadas o respaldadas por TradingView. Obtenga más información en Condiciones de uso.