OPEN-SOURCE SCRIPT
Coil & Fire - Ashish
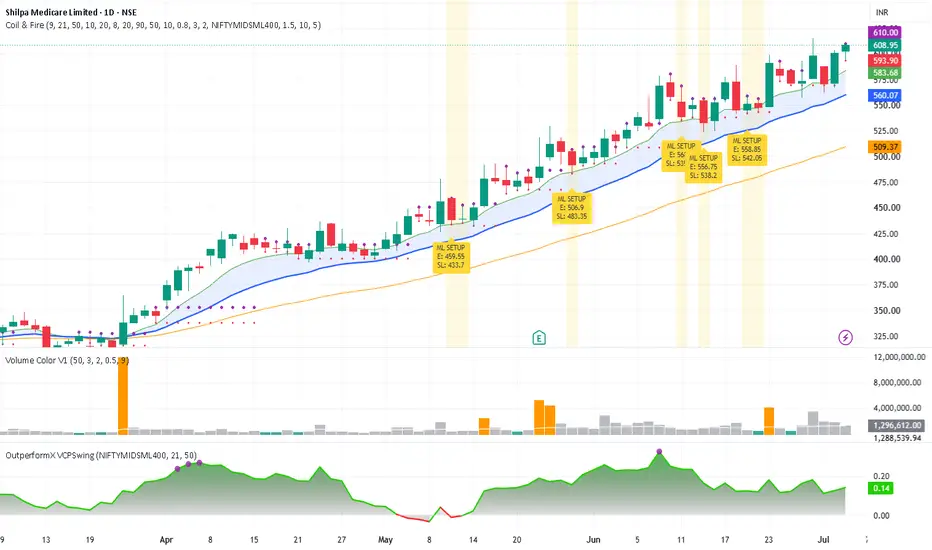
*Updated version of Momentum Scanner*
Finds stocks that had a strong explosive move (EP candle), are now coiling quietly near their EMAs, and marks the exact entry and stop-loss levels based on the most recent low-volume healthy-dip candle.
How it works:
Screens for stocks with a recent 8%+ single-day move that are outperforming their benchmark since that move, holding above the EMA9/21 cloud with the trend structure intact, and showing genuinely quiet volume on the pullback. When all conditions align, it marks a teal bar — a low-volume healthy-dip candle sitting within 5% above EMA9. The high of that bar is your entry. The low is your stop-loss. Purple dots show the entry level. Red dots show the stop.
Orange background = price has crossed the entry level. Yellow background = setup is valid, waiting for the trigger.
What's different from Momentum Scanner:
Entry and stop-loss are now anchored to the most recent teal bar rather than a historical coil-high level, so levels are always close to current price. Volume comparison for the teal bar now uses a 10-day average instead of 50-day, making it more responsive to recent trading activity rather than a long historical baseline.
Note: Indicators are tools, not oracles — every signal still requires human judgment, risk management, and context before any trade is taken.
Finds stocks that had a strong explosive move (EP candle), are now coiling quietly near their EMAs, and marks the exact entry and stop-loss levels based on the most recent low-volume healthy-dip candle.
How it works:
Screens for stocks with a recent 8%+ single-day move that are outperforming their benchmark since that move, holding above the EMA9/21 cloud with the trend structure intact, and showing genuinely quiet volume on the pullback. When all conditions align, it marks a teal bar — a low-volume healthy-dip candle sitting within 5% above EMA9. The high of that bar is your entry. The low is your stop-loss. Purple dots show the entry level. Red dots show the stop.
Orange background = price has crossed the entry level. Yellow background = setup is valid, waiting for the trigger.
What's different from Momentum Scanner:
Entry and stop-loss are now anchored to the most recent teal bar rather than a historical coil-high level, so levels are always close to current price. Volume comparison for the teal bar now uses a 10-day average instead of 50-day, making it more responsive to recent trading activity rather than a long historical baseline.
Note: Indicators are tools, not oracles — every signal still requires human judgment, risk management, and context before any trade is taken.
Script de código abierto
Fiel al espíritu de TradingView, el creador de este script lo ha convertido en código abierto, para que los traders puedan revisar y verificar su funcionalidad. ¡Enhorabuena al autor! Aunque puede utilizarlo de forma gratuita, recuerde que cualquier republicación del código está sujeta a nuestras Normas internas.

Exención de responsabilidad
La información y las publicaciones no constituyen, ni deben considerarse como, asesoramiento o recomendaciones financieras, de inversión, de trading u otro tipo, proporcionadas o respaldadas por TradingView. Obtenga más información en Condiciones de uso.
Script de código abierto
Fiel al espíritu de TradingView, el creador de este script lo ha convertido en código abierto, para que los traders puedan revisar y verificar su funcionalidad. ¡Enhorabuena al autor! Aunque puede utilizarlo de forma gratuita, recuerde que cualquier republicación del código está sujeta a nuestras Normas internas.
Exención de responsabilidad
La información y las publicaciones no constituyen, ni deben considerarse como, asesoramiento o recomendaciones financieras, de inversión, de trading u otro tipo, proporcionadas o respaldadas por TradingView. Obtenga más información en Condiciones de uso.