SMA Fill, Cross, S/R, Trendlines, FVG by Green Boyz
## SMA 13/21 Fill + Cross + Support/Resistance + Trendlines + FVG by GreenBoyz
### Overview
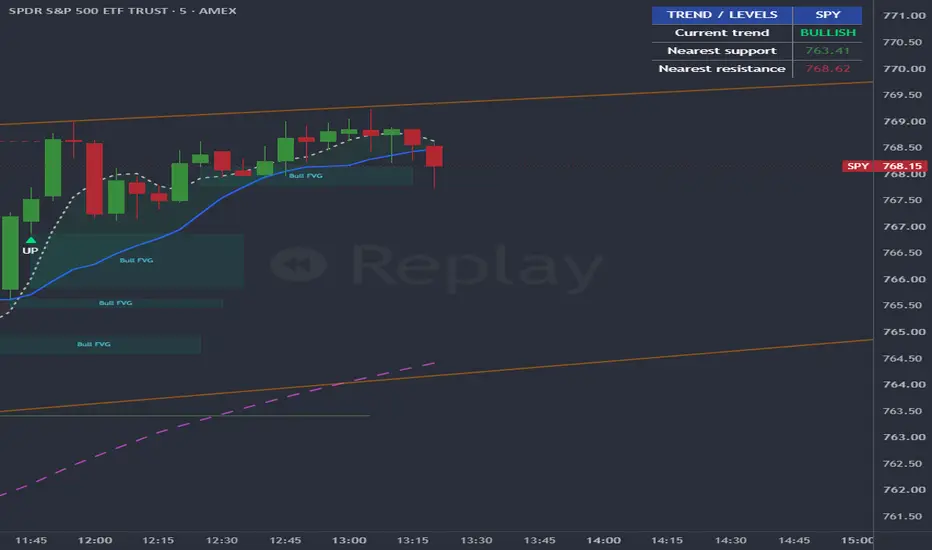
This **indicator** combines moving-average trend analysis, crossover markers, pivot-based support and resistance, automatic trendlines, and fair value gap visualization in one chart overlay.
It is designed to help traders view trend direction and price structure together, with adjustable drawing lengths and customizable colors.
### Moving Averages and Trend Fill
The indicator displays three simple moving averages with default lengths of 13, 21, and 100. Each length, line color, and line thickness can be adjusted.
The fill between the fast and middle SMAs highlights their relationship:
- Bullish fill: The fast SMA is above the middle SMA.
- Bearish fill: The fast SMA is below the middle SMA.
- Neutral fill: The two SMAs are equal.
Fill colors and transparency are customizable.
### Confirmed Crossover Markers
The indicator marks crosses between the fast and middle SMAs:
- UP: The fast SMA crosses above the middle SMA.
- DN: The fast SMA crosses below the middle SMA.
Markers appear only after the crossover candle closes. They identify moving-average crosses—not automatic trade entries—and do not require confirmation from the slow SMA.
### Trend-Based Candle Colors
Optional candle coloring uses the alignment of all three SMAs:
- Bullish: Fast SMA > Middle SMA > Slow SMA.
- Bearish: Fast SMA < Middle SMA < Slow SMA.
- Neutral: Neither alignment is present.
Candle coloring begins once all three moving averages have sufficient data. Because this trend classification includes the slow SMA, candle colors may differ from the two-SMA fill.
### Major Support and Resistance
Support and resistance levels are drawn from confirmed pivot lows and pivot highs.
Available settings include:
- Pivot strength.
- Number of retained levels per side.
- Line length in bars.
- Line thickness.
- Separate support and resistance colors.
Lines begin at the original pivot candle and have a fixed, adjustable length rather than extending indefinitely. Once a candle closes below an original support level or above an original resistance level, that line becomes dashed.
The dashboard identifies the nearest retained levels above and below the current price, allowing a former resistance level to be treated as support, or vice versa. Retained levels remain available to the dashboard even after their visible line segments end.
### Automatic Trendlines
The indicator connects the two most recently confirmed pivot lows and the two most recently confirmed pivot highs.
These lines extend to the right and update as new pivots are confirmed. Pivot sensitivity, line thickness, and the colors of the low-to-low and high-to-high lines are adjustable.
The lines connect successive pivots; they do not require the lows to be rising or the highs to be falling.
### Fair Value Gaps
The indicator detects three-candle price gaps using the following conditions:
- Bullish FVG: The current candle’s low is above the high from two candles earlier.
- Bearish FVG: The current candle’s high is below the low from two candles earlier.
Gaps are created after the detection candle closes. An adjustable minimum-size filter compares the gap size with the current 14-period ATR.
FVG display settings include:
- Separate bullish and bearish fill colors.
- Separate bullish and bearish border colors.
- Text color and fill transparency.
- Maximum number of retained gaps.
- Extension length in bars.
- Optional continuous extension ahead of the current candle.
A bullish gap is removed when a subsequent candle’s wick reaches its lower boundary. A bearish gap is removed when a subsequent candle’s wick reaches its upper boundary. Removal occurs after that candle closes. Partial fills leave the original gap boundaries unchanged.
The extension setting controls the visible box length, not gap expiration. With fixed extension enabled, a gap can remain tracked after its box endpoint until it is filled or removed by the maximum-gap limit.
### Dashboard
The optional dashboard displays:
- Chart symbol.
- Current three-SMA trend classification.
- Nearest retained support.
- Nearest retained resistance.
Background, header, border, and text colors are customizable.
### Timing and Interpretation
Pivot-based support, resistance, and trendlines require the selected number of right-side candles before confirmation. They are then drawn back at the original pivot locations, so those drawings were not available on the pivot candle itself.
Crossover markers are confirmed at candle close. Moving averages, their fill, candle colors, and dashboard values can still change while the current candle is forming.
This script is a visual analysis tool, not an automated strategy. It does not place orders, define stop-loss or take-profit levels, or provide backtested performance results. Crossover markers, pivot levels, and FVGs should not be interpreted as guaranteed trading signals.
### Disclaimer
For educational and informational purposes only. This indicator does not provide financial advice or guarantee trading results. Trading involves risk, and users are responsible for their own decisions.
### Overview
This **indicator** combines moving-average trend analysis, crossover markers, pivot-based support and resistance, automatic trendlines, and fair value gap visualization in one chart overlay.
It is designed to help traders view trend direction and price structure together, with adjustable drawing lengths and customizable colors.
### Moving Averages and Trend Fill
The indicator displays three simple moving averages with default lengths of 13, 21, and 100. Each length, line color, and line thickness can be adjusted.
The fill between the fast and middle SMAs highlights their relationship:
- Bullish fill: The fast SMA is above the middle SMA.
- Bearish fill: The fast SMA is below the middle SMA.
- Neutral fill: The two SMAs are equal.
Fill colors and transparency are customizable.
### Confirmed Crossover Markers
The indicator marks crosses between the fast and middle SMAs:
- UP: The fast SMA crosses above the middle SMA.
- DN: The fast SMA crosses below the middle SMA.
Markers appear only after the crossover candle closes. They identify moving-average crosses—not automatic trade entries—and do not require confirmation from the slow SMA.
### Trend-Based Candle Colors
Optional candle coloring uses the alignment of all three SMAs:
- Bullish: Fast SMA > Middle SMA > Slow SMA.
- Bearish: Fast SMA < Middle SMA < Slow SMA.
- Neutral: Neither alignment is present.
Candle coloring begins once all three moving averages have sufficient data. Because this trend classification includes the slow SMA, candle colors may differ from the two-SMA fill.
### Major Support and Resistance
Support and resistance levels are drawn from confirmed pivot lows and pivot highs.
Available settings include:
- Pivot strength.
- Number of retained levels per side.
- Line length in bars.
- Line thickness.
- Separate support and resistance colors.
Lines begin at the original pivot candle and have a fixed, adjustable length rather than extending indefinitely. Once a candle closes below an original support level or above an original resistance level, that line becomes dashed.
The dashboard identifies the nearest retained levels above and below the current price, allowing a former resistance level to be treated as support, or vice versa. Retained levels remain available to the dashboard even after their visible line segments end.
### Automatic Trendlines
The indicator connects the two most recently confirmed pivot lows and the two most recently confirmed pivot highs.
These lines extend to the right and update as new pivots are confirmed. Pivot sensitivity, line thickness, and the colors of the low-to-low and high-to-high lines are adjustable.
The lines connect successive pivots; they do not require the lows to be rising or the highs to be falling.
### Fair Value Gaps
The indicator detects three-candle price gaps using the following conditions:
- Bullish FVG: The current candle’s low is above the high from two candles earlier.
- Bearish FVG: The current candle’s high is below the low from two candles earlier.
Gaps are created after the detection candle closes. An adjustable minimum-size filter compares the gap size with the current 14-period ATR.
FVG display settings include:
- Separate bullish and bearish fill colors.
- Separate bullish and bearish border colors.
- Text color and fill transparency.
- Maximum number of retained gaps.
- Extension length in bars.
- Optional continuous extension ahead of the current candle.
A bullish gap is removed when a subsequent candle’s wick reaches its lower boundary. A bearish gap is removed when a subsequent candle’s wick reaches its upper boundary. Removal occurs after that candle closes. Partial fills leave the original gap boundaries unchanged.
The extension setting controls the visible box length, not gap expiration. With fixed extension enabled, a gap can remain tracked after its box endpoint until it is filled or removed by the maximum-gap limit.
### Dashboard
The optional dashboard displays:
- Chart symbol.
- Current three-SMA trend classification.
- Nearest retained support.
- Nearest retained resistance.
Background, header, border, and text colors are customizable.
### Timing and Interpretation
Pivot-based support, resistance, and trendlines require the selected number of right-side candles before confirmation. They are then drawn back at the original pivot locations, so those drawings were not available on the pivot candle itself.
Crossover markers are confirmed at candle close. Moving averages, their fill, candle colors, and dashboard values can still change while the current candle is forming.
This script is a visual analysis tool, not an automated strategy. It does not place orders, define stop-loss or take-profit levels, or provide backtested performance results. Crossover markers, pivot levels, and FVGs should not be interpreted as guaranteed trading signals.
### Disclaimer
For educational and informational purposes only. This indicator does not provide financial advice or guarantee trading results. Trading involves risk, and users are responsible for their own decisions.

Exención de responsabilidad
La información y las publicaciones no constituyen, ni deben considerarse como, asesoramiento o recomendaciones financieras, de inversión, de trading u otro tipo, proporcionadas o respaldadas por TradingView. Obtenga más información en Condiciones de uso.
Exención de responsabilidad
La información y las publicaciones no constituyen, ni deben considerarse como, asesoramiento o recomendaciones financieras, de inversión, de trading u otro tipo, proporcionadas o respaldadas por TradingView. Obtenga más información en Condiciones de uso.