kDashboard - Fundamentals & Technicals
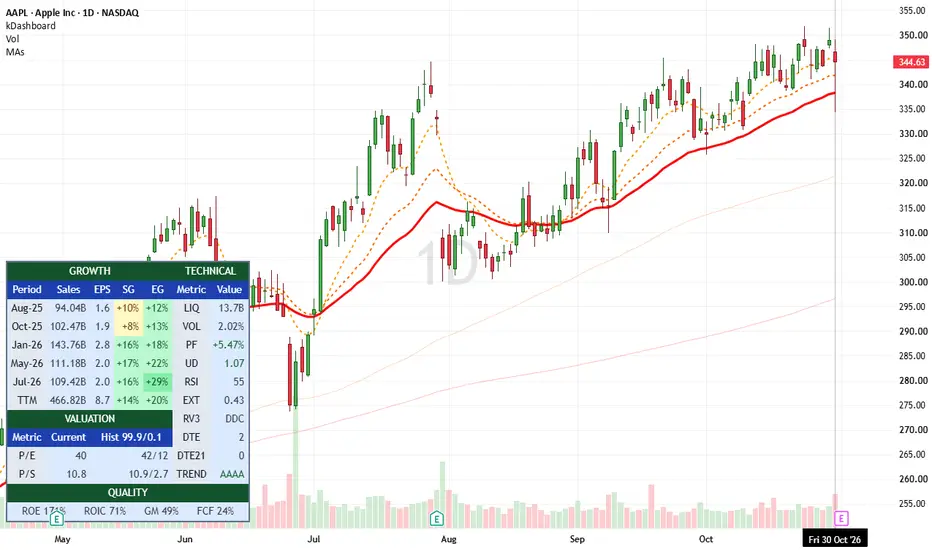
# kDashboard - Fundamentals and Technicals
**Version 1.0.0 | Pine Script v6**
## Overview
kDashboard is a compact, multi-factor equity analysis dashboard that integrates four dimensions of stock analysis into one TradingView chart overlay:
1. **Growth:** Revenue and earnings growth across five reported quarters and trailing twelve months.
2. **Valuation:** Current P/E and P/S relative to historical valuation distributions.
3. **Technical:** Liquidity, volatility, relative performance, buying/selling pressure, momentum, price extension, volume participation, earnings proximity and trend alignment.
4. **Quality:** Profitability, capital efficiency, gross margins and free cash flow margins.
The primary purpose is to allow traders and investors to assess a stock's fundamental characteristics alongside its technical behavior without switching between multiple indicators.
It is an analytical dashboard, not an automated trading strategy, signal generator or buy/sell recommendation system.
## GROWTH
The Growth section presents five historical quarterly observations, ordered from oldest to newest, and a TTM summary.
**Sales:** Reported quarterly total revenue, displayed in compact K/M/B/T notation.
**EPS:** Quarterly earnings per share, using reported actual EPS where available and standardized EPS as a fallback.
**SG (Sales Growth):** Year-over-year percentage change in quarterly revenue. Reported revenue growth is preferred where available; otherwise, the indicator calculates the change from corresponding historical quarters.
**EG (Earnings Growth):** Year-over-year percentage change in quarterly EPS, calculated using the corresponding quarter from the previous year.
**TTM (Trailing Twelve Months):** Sum of the most recent four quarterly sales and EPS observations.
**TTM SG and EG:** Percentage changes between the latest four-quarter totals and the preceding four-quarter totals.
The percentage-change calculation uses the absolute value of the prior period as its denominator. This permits consistent arithmetic when prior-period earnings are negative, but the results should not be interpreted as conventional percentage growth without reviewing the underlying earnings.
Growth values are color-coded:
- Strong green: growth at least 25%.
- Green: growth from 10% to below 25%.
- Neutral: growth from 0% to below 10%.
- Orange: decline greater than 0% and up to 10%.
- Red: decline exceeding 10%.
Unavailable figures are displayed with a dash.
## VALUATION
**P/E (Price-to-Earnings Ratio)**
Current share price divided by reported trailing-twelve-month diluted EPS.
P/E is unavailable when EPS is zero, negative or missing.
**P/S (Price-to-Sales Ratio)**
Estimated market capitalization divided by reported trailing-twelve-month revenue.
Market capitalization is estimated from the current share price and reported shares outstanding.
**10Y 99.9/0.1**
The historical 99.9th and 0.1st percentiles of positive daily P/E or P/S observations over approximately 2,520 daily trading sessions, where sufficient historical data is available.
These percentiles provide historical valuation context while reducing the impact of the most extreme outliers.
They are not fair-value estimates, price targets or statistical confidence intervals. Historical data coverage depends on the available price history, financial reports and TradingView data limits.
## TECHNICAL
All technical metrics use daily price/volume data unless otherwise specified.
**LIQ — Liquidity**
The simple average of daily closing price multiplied by traded volume over 21 sessions.
LIQ = SMA(Close × Volume, 21)
This estimates average daily traded value, rather than actual executable liquidity, order-book depth or bid-ask spreads.
**VOL — Volatility**
The 21-day Average True Range divided by the 21-day simple moving average of closing prices.
VOL = ATR(21) / SMA(Close, 21) × 100
This measures price movement relative to the instrument's price level.
**PF — Relative Performance**
The instrument's 21-session return relative to the selected benchmark, SPY by default.
PF = [(Stock Close / Stock Close 21 sessions ago) / (Benchmark Close / Benchmark Close 21 sessions ago) − 1] × 100
A positive PF indicates the stock has outperformed the benchmark on a compounded relative-return basis over the measured period; a negative value indicates underperformance.
**UD — Up/Down Pressure Ratio**
A volume-weighted accumulation/distribution proxy calculated over 500 bars on a configurable timeframe, defaulting to 30 minutes.
Each candle's volume is divided into upward and downward pressure according to the closing price's position within its high-low range.
Close Location = (Close − Low) / (High − Low)
Up Pressure = Volume × Close Location
Down Pressure = Volume × (1 − Close Location)
UD = Average Up Pressure / Average Down Pressure
A value above 1 indicates greater estimated upward than downward pressure; below 1 indicates the reverse.
UD is a price-location-based approximation, not a measure of actual buyer-initiated or seller-initiated transactions.
**RSI — Relative Strength Index**
Standard 14-period daily RSI, measuring momentum on a 0–100 scale.
Readings above 70 are highlighted as overbought conditions and readings below 30 as oversold conditions. These levels do not independently constitute reversal signals.
**EXT — Normalized Price Extension**
Measures the average signed percentage distance between the current closing price and three exponential moving averages, normalized by volatility.
EMA9 is calculated using HLC3, while EMA21 and EMA34 use closing prices.
EXT = Average[(Close/EMA9 − 1), (Close/EMA21 − 1), (Close/EMA34 − 1)] × 100 / VOL
Positive readings indicate average price extension above the moving averages; negative readings indicate extension below them.
This is a signed normalized measure, not an absolute-distance measure.
**RV3 — Three-Day Relative Volume Grades**
Three alphabetic grades representing relative volume on the previous three completed trading sessions.
Relative Volume = Daily Volume / Average Volume of the preceding 10 sessions
Default grade thresholds:
A: at least 2.00×
B: at least 1.50× and below 2.00×
C: at least 1.00× and below 1.50×
D: at least 0.75× and below 1.00×
E: below 0.75×
Grades are displayed oldest to newest, allowing users to recognize recent changes in volume participation.
**DTE — Days to Earnings**
Number of whole calendar days until the next earnings timestamp provided by TradingView.
Unavailable future earnings information is displayed as a dash.
**DTE21 — Days Since EMA21 Interaction**
Number of daily price bars since the most recent interaction with the 21-day exponential moving average.
An interaction occurs when:
- The candle range touches the EMA21.
- The closing price changes sides relative to the EMA21 between consecutive sessions.
- The closing price equals the EMA21.
This metric measures elapsed trading bars, not calendar days.
**TREND — Multi-Horizon Moving-Average Alignment**
Four-character trend code representing four time horizons.
Long-term: SMA200 / SMA500 / SMA1000
Medium-term: SMA50 / SMA100 / SMA200
Short-term: EMA9 / EMA21 / EMA34
Fast-term: EMA5 / EMA9 / EMA13
For each horizon:
A = Fast MA above Middle MA above Slow MA
B = Neither fully bullish nor fully bearish
C = Fast MA below Middle MA below Slow MA
The combined four-letter code summarizes moving-average alignment across multiple horizons.
The trend classification describes alignment only. It does not independently measure trend strength or predict future returns.
## QUALITY
The Quality section displays four profitability and capital-efficiency metrics in a single compact row.
**ROE — Return on Equity**
Net income relative to average shareholders' equity, expressed as a percentage.
ROE measures profitability attributable to shareholders' invested equity. High ROE can be influenced by financial leverage or a small equity base.
**ROIC — Return on Invested Capital**
After-tax operating profitability relative to invested capital, expressed as a percentage.
ROIC assesses how efficiently a business generates returns from capital used in its operations. It complements ROE by considering a broader capital base.
**GM — Gross Margin**
Gross profit divided by revenue, expressed as a percentage.
GM measures the proportion of sales retained after direct costs of producing or delivering goods and services.
**FCF — Free Cash Flow Margin**
Free cash flow divided by revenue, expressed as a percentage.
FCF margin measures how much revenue is converted into free cash flow after capital expenditure.
The dashboard uses TradingView's reported financial metrics: fiscal-year ROE, fiscal-year ROIC, TTM gross margin and fiscal-year FCF margin.
All four values are displayed as whole percentages.
Financial reporting methodologies and availability may vary by exchange, company, accounting standard and data provider.
## HOW TO USE
kDashboard is designed to support a structured assessment of a stock.
Start with Growth and Quality to understand business performance and financial efficiency. Review Valuation to place current pricing in historical context. Then use Technical metrics to assess participation, momentum, volatility, price extension and prevailing trend alignment.
For example, a company can exhibit strong sales growth and ROIC but weak price momentum. Alternatively, a stock may have strong technical performance despite declining fundamentals or demanding valuation.
The dashboard is most useful when these differences are considered explicitly rather than assuming that all metrics must agree.
## ORIGINAL CONTRIBUTION
kDashboard combines multi-quarter financial growth, historical valuation percentile ranges, capital-efficiency metrics, an intraday volume-pressure proxy, volatility-normalized price extension, three-session relative-volume grading and multi-horizon trend classification in one compact chart overlay.
The objective is comparative efficiency: presenting information that would otherwise require several separate panels and data sources, without converting it into a black-box score.
## LIMITATIONS
- Designed primarily for equities with sufficiently complete financial reporting.
- Financial information may be revised, delayed or unavailable.
- Quarterly sales and EPS event alignment depends on the underlying TradingView datasets and should be independently verified.
- Historical valuation samples may not span a full 10 calendar years.
- Missing long-term moving-average history can affect trend classification.
- Intraday UD depends on data availability and the configured calculation timeframe.
- Financial ratios may not be directly comparable across industries, particularly financial companies and nonfinancial businesses.
- The indicator is not a backtested trading strategy and provides no performance guarantee.
**Disclaimer:** For educational and analytical use only. Nothing in this indicator constitutes investment advice, a trading recommendation or a guarantee of future results.
**Version 1.0.0 | Pine Script v6**
## Overview
kDashboard is a compact, multi-factor equity analysis dashboard that integrates four dimensions of stock analysis into one TradingView chart overlay:
1. **Growth:** Revenue and earnings growth across five reported quarters and trailing twelve months.
2. **Valuation:** Current P/E and P/S relative to historical valuation distributions.
3. **Technical:** Liquidity, volatility, relative performance, buying/selling pressure, momentum, price extension, volume participation, earnings proximity and trend alignment.
4. **Quality:** Profitability, capital efficiency, gross margins and free cash flow margins.
The primary purpose is to allow traders and investors to assess a stock's fundamental characteristics alongside its technical behavior without switching between multiple indicators.
It is an analytical dashboard, not an automated trading strategy, signal generator or buy/sell recommendation system.
## GROWTH
The Growth section presents five historical quarterly observations, ordered from oldest to newest, and a TTM summary.
**Sales:** Reported quarterly total revenue, displayed in compact K/M/B/T notation.
**EPS:** Quarterly earnings per share, using reported actual EPS where available and standardized EPS as a fallback.
**SG (Sales Growth):** Year-over-year percentage change in quarterly revenue. Reported revenue growth is preferred where available; otherwise, the indicator calculates the change from corresponding historical quarters.
**EG (Earnings Growth):** Year-over-year percentage change in quarterly EPS, calculated using the corresponding quarter from the previous year.
**TTM (Trailing Twelve Months):** Sum of the most recent four quarterly sales and EPS observations.
**TTM SG and EG:** Percentage changes between the latest four-quarter totals and the preceding four-quarter totals.
The percentage-change calculation uses the absolute value of the prior period as its denominator. This permits consistent arithmetic when prior-period earnings are negative, but the results should not be interpreted as conventional percentage growth without reviewing the underlying earnings.
Growth values are color-coded:
- Strong green: growth at least 25%.
- Green: growth from 10% to below 25%.
- Neutral: growth from 0% to below 10%.
- Orange: decline greater than 0% and up to 10%.
- Red: decline exceeding 10%.
Unavailable figures are displayed with a dash.
## VALUATION
**P/E (Price-to-Earnings Ratio)**
Current share price divided by reported trailing-twelve-month diluted EPS.
P/E is unavailable when EPS is zero, negative or missing.
**P/S (Price-to-Sales Ratio)**
Estimated market capitalization divided by reported trailing-twelve-month revenue.
Market capitalization is estimated from the current share price and reported shares outstanding.
**10Y 99.9/0.1**
The historical 99.9th and 0.1st percentiles of positive daily P/E or P/S observations over approximately 2,520 daily trading sessions, where sufficient historical data is available.
These percentiles provide historical valuation context while reducing the impact of the most extreme outliers.
They are not fair-value estimates, price targets or statistical confidence intervals. Historical data coverage depends on the available price history, financial reports and TradingView data limits.
## TECHNICAL
All technical metrics use daily price/volume data unless otherwise specified.
**LIQ — Liquidity**
The simple average of daily closing price multiplied by traded volume over 21 sessions.
LIQ = SMA(Close × Volume, 21)
This estimates average daily traded value, rather than actual executable liquidity, order-book depth or bid-ask spreads.
**VOL — Volatility**
The 21-day Average True Range divided by the 21-day simple moving average of closing prices.
VOL = ATR(21) / SMA(Close, 21) × 100
This measures price movement relative to the instrument's price level.
**PF — Relative Performance**
The instrument's 21-session return relative to the selected benchmark, SPY by default.
PF = [(Stock Close / Stock Close 21 sessions ago) / (Benchmark Close / Benchmark Close 21 sessions ago) − 1] × 100
A positive PF indicates the stock has outperformed the benchmark on a compounded relative-return basis over the measured period; a negative value indicates underperformance.
**UD — Up/Down Pressure Ratio**
A volume-weighted accumulation/distribution proxy calculated over 500 bars on a configurable timeframe, defaulting to 30 minutes.
Each candle's volume is divided into upward and downward pressure according to the closing price's position within its high-low range.
Close Location = (Close − Low) / (High − Low)
Up Pressure = Volume × Close Location
Down Pressure = Volume × (1 − Close Location)
UD = Average Up Pressure / Average Down Pressure
A value above 1 indicates greater estimated upward than downward pressure; below 1 indicates the reverse.
UD is a price-location-based approximation, not a measure of actual buyer-initiated or seller-initiated transactions.
**RSI — Relative Strength Index**
Standard 14-period daily RSI, measuring momentum on a 0–100 scale.
Readings above 70 are highlighted as overbought conditions and readings below 30 as oversold conditions. These levels do not independently constitute reversal signals.
**EXT — Normalized Price Extension**
Measures the average signed percentage distance between the current closing price and three exponential moving averages, normalized by volatility.
EMA9 is calculated using HLC3, while EMA21 and EMA34 use closing prices.
EXT = Average[(Close/EMA9 − 1), (Close/EMA21 − 1), (Close/EMA34 − 1)] × 100 / VOL
Positive readings indicate average price extension above the moving averages; negative readings indicate extension below them.
This is a signed normalized measure, not an absolute-distance measure.
**RV3 — Three-Day Relative Volume Grades**
Three alphabetic grades representing relative volume on the previous three completed trading sessions.
Relative Volume = Daily Volume / Average Volume of the preceding 10 sessions
Default grade thresholds:
A: at least 2.00×
B: at least 1.50× and below 2.00×
C: at least 1.00× and below 1.50×
D: at least 0.75× and below 1.00×
E: below 0.75×
Grades are displayed oldest to newest, allowing users to recognize recent changes in volume participation.
**DTE — Days to Earnings**
Number of whole calendar days until the next earnings timestamp provided by TradingView.
Unavailable future earnings information is displayed as a dash.
**DTE21 — Days Since EMA21 Interaction**
Number of daily price bars since the most recent interaction with the 21-day exponential moving average.
An interaction occurs when:
- The candle range touches the EMA21.
- The closing price changes sides relative to the EMA21 between consecutive sessions.
- The closing price equals the EMA21.
This metric measures elapsed trading bars, not calendar days.
**TREND — Multi-Horizon Moving-Average Alignment**
Four-character trend code representing four time horizons.
Long-term: SMA200 / SMA500 / SMA1000
Medium-term: SMA50 / SMA100 / SMA200
Short-term: EMA9 / EMA21 / EMA34
Fast-term: EMA5 / EMA9 / EMA13
For each horizon:
A = Fast MA above Middle MA above Slow MA
B = Neither fully bullish nor fully bearish
C = Fast MA below Middle MA below Slow MA
The combined four-letter code summarizes moving-average alignment across multiple horizons.
The trend classification describes alignment only. It does not independently measure trend strength or predict future returns.
## QUALITY
The Quality section displays four profitability and capital-efficiency metrics in a single compact row.
**ROE — Return on Equity**
Net income relative to average shareholders' equity, expressed as a percentage.
ROE measures profitability attributable to shareholders' invested equity. High ROE can be influenced by financial leverage or a small equity base.
**ROIC — Return on Invested Capital**
After-tax operating profitability relative to invested capital, expressed as a percentage.
ROIC assesses how efficiently a business generates returns from capital used in its operations. It complements ROE by considering a broader capital base.
**GM — Gross Margin**
Gross profit divided by revenue, expressed as a percentage.
GM measures the proportion of sales retained after direct costs of producing or delivering goods and services.
**FCF — Free Cash Flow Margin**
Free cash flow divided by revenue, expressed as a percentage.
FCF margin measures how much revenue is converted into free cash flow after capital expenditure.
The dashboard uses TradingView's reported financial metrics: fiscal-year ROE, fiscal-year ROIC, TTM gross margin and fiscal-year FCF margin.
All four values are displayed as whole percentages.
Financial reporting methodologies and availability may vary by exchange, company, accounting standard and data provider.
## HOW TO USE
kDashboard is designed to support a structured assessment of a stock.
Start with Growth and Quality to understand business performance and financial efficiency. Review Valuation to place current pricing in historical context. Then use Technical metrics to assess participation, momentum, volatility, price extension and prevailing trend alignment.
For example, a company can exhibit strong sales growth and ROIC but weak price momentum. Alternatively, a stock may have strong technical performance despite declining fundamentals or demanding valuation.
The dashboard is most useful when these differences are considered explicitly rather than assuming that all metrics must agree.
## ORIGINAL CONTRIBUTION
kDashboard combines multi-quarter financial growth, historical valuation percentile ranges, capital-efficiency metrics, an intraday volume-pressure proxy, volatility-normalized price extension, three-session relative-volume grading and multi-horizon trend classification in one compact chart overlay.
The objective is comparative efficiency: presenting information that would otherwise require several separate panels and data sources, without converting it into a black-box score.
## LIMITATIONS
- Designed primarily for equities with sufficiently complete financial reporting.
- Financial information may be revised, delayed or unavailable.
- Quarterly sales and EPS event alignment depends on the underlying TradingView datasets and should be independently verified.
- Historical valuation samples may not span a full 10 calendar years.
- Missing long-term moving-average history can affect trend classification.
- Intraday UD depends on data availability and the configured calculation timeframe.
- Financial ratios may not be directly comparable across industries, particularly financial companies and nonfinancial businesses.
- The indicator is not a backtested trading strategy and provides no performance guarantee.
**Disclaimer:** For educational and analytical use only. Nothing in this indicator constitutes investment advice, a trading recommendation or a guarantee of future results.

Exención de responsabilidad
La información y las publicaciones no constituyen, ni deben considerarse como, asesoramiento o recomendaciones financieras, de inversión, de trading u otro tipo, proporcionadas o respaldadas por TradingView. Obtenga más información en Condiciones de uso.
Exención de responsabilidad
La información y las publicaciones no constituyen, ni deben considerarse como, asesoramiento o recomendaciones financieras, de inversión, de trading u otro tipo, proporcionadas o respaldadas por TradingView. Obtenga más información en Condiciones de uso.