HTF FVG as a POI
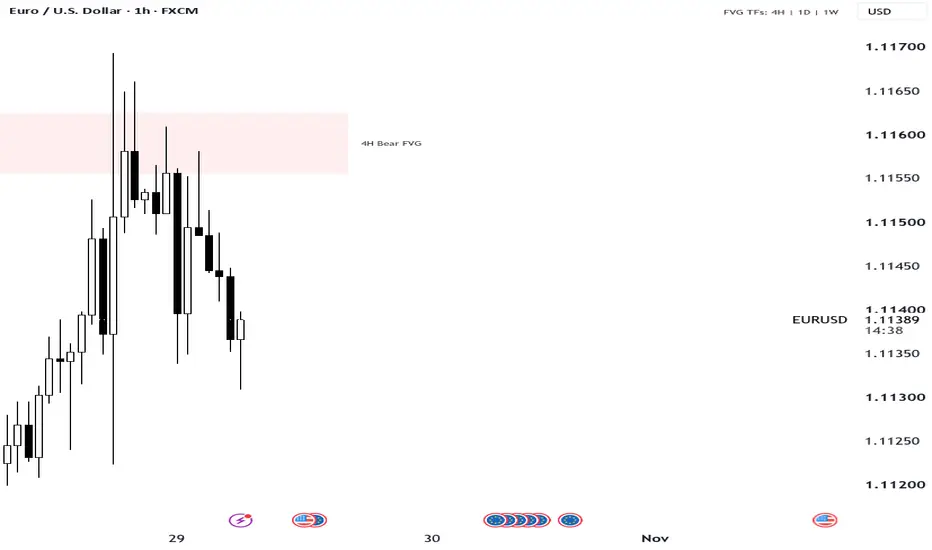
Short description (one line):
Shows higher-timeframe Fair Value Gaps only when price is near them, so your chart stays clean until a zone matters.
Description:
HTF FVG POI tracks Fair Value Gaps from higher timeframes and displays them only when price approaches. Most FVG indicators draw every gap they find, which quickly fills the chart. This one keeps gaps in memory and shows only the nearest few, when you’re close to them.
How it works
It scans three higher timeframes for classic three-candle FVGs: a gap between the first candle’s high and the third candle’s low (bullish), or the reverse (bearish).
Gaps are created only after the higher-timeframe candle has closed, so zones are not altered by candles that are still forming.
A zone is drawn only when price is within a set distance of it, measured in ATR of your chart timeframe. Once showing, it stays until price is clearly away, so it doesn’t flicker at the edge.
Only the nearest zones are shown, up to a cap you choose (default 3).
Tiny gaps are ignored using a minimum size, also measured in ATR.
A zone is removed for good once it is mitigated. By default that means a candle closes beyond the far side of the gap. A wick through it and the 50% midpoint are also available as options.
When price touches a zone, its fill strengthens and its label adds “(in)”.
Automatic timeframes
The higher timeframes are chosen from your chart timeframe:
1m and 5m: 15m, 1H, 4H
3m: 30m, 1H, 4H
15m and 30m: 1H, 4H, 1D
1H: 4H, 1D, 1W
4H: 1D, 1W
You can turn this off and set your own three timeframes. A small note in the corner shows which timeframes are active.
Settings
Show Within and Hide Beyond distance (x ATR)
Minimum gap size (x ATR)
Maximum zones shown
Bias filter: all, bullish only or bearish only
Trade-side only: bullish gaps only below price, bearish gaps only above
Mitigation rule, colours, labels, and how far zones extend to the right
Alerts
Create an alert on the indicator with the condition “Any alert() function call”. Two alert types are available, each switchable in settings:
Approach: price comes within range of a zone.
First tap: price touches a zone for the first time (once per zone).
Messages include the zone’s timeframe and direction.
How to use it
Use it as a map of higher-timeframe areas of interest, such as where price may react, reverse or continue. It works best alongside your own market structure and confirmation. It does not generate trade signals.
Notes
Only gaps within the bars loaded on your chart are tracked.
Zones shown reflect the current chart state and are not drawn historically.
This script is for educational and informational purposes only and is not financial advice.
Shows higher-timeframe Fair Value Gaps only when price is near them, so your chart stays clean until a zone matters.
Description:
HTF FVG POI tracks Fair Value Gaps from higher timeframes and displays them only when price approaches. Most FVG indicators draw every gap they find, which quickly fills the chart. This one keeps gaps in memory and shows only the nearest few, when you’re close to them.
How it works
It scans three higher timeframes for classic three-candle FVGs: a gap between the first candle’s high and the third candle’s low (bullish), or the reverse (bearish).
Gaps are created only after the higher-timeframe candle has closed, so zones are not altered by candles that are still forming.
A zone is drawn only when price is within a set distance of it, measured in ATR of your chart timeframe. Once showing, it stays until price is clearly away, so it doesn’t flicker at the edge.
Only the nearest zones are shown, up to a cap you choose (default 3).
Tiny gaps are ignored using a minimum size, also measured in ATR.
A zone is removed for good once it is mitigated. By default that means a candle closes beyond the far side of the gap. A wick through it and the 50% midpoint are also available as options.
When price touches a zone, its fill strengthens and its label adds “(in)”.
Automatic timeframes
The higher timeframes are chosen from your chart timeframe:
1m and 5m: 15m, 1H, 4H
3m: 30m, 1H, 4H
15m and 30m: 1H, 4H, 1D
1H: 4H, 1D, 1W
4H: 1D, 1W
You can turn this off and set your own three timeframes. A small note in the corner shows which timeframes are active.
Settings
Show Within and Hide Beyond distance (x ATR)
Minimum gap size (x ATR)
Maximum zones shown
Bias filter: all, bullish only or bearish only
Trade-side only: bullish gaps only below price, bearish gaps only above
Mitigation rule, colours, labels, and how far zones extend to the right
Alerts
Create an alert on the indicator with the condition “Any alert() function call”. Two alert types are available, each switchable in settings:
Approach: price comes within range of a zone.
First tap: price touches a zone for the first time (once per zone).
Messages include the zone’s timeframe and direction.
How to use it
Use it as a map of higher-timeframe areas of interest, such as where price may react, reverse or continue. It works best alongside your own market structure and confirmation. It does not generate trade signals.
Notes
Only gaps within the bars loaded on your chart are tracked.
Zones shown reflect the current chart state and are not drawn historically.
This script is for educational and informational purposes only and is not financial advice.

Exención de responsabilidad
La información y las publicaciones no constituyen, ni deben considerarse como, asesoramiento o recomendaciones financieras, de inversión, de trading u otro tipo, proporcionadas o respaldadas por TradingView. Obtenga más información en Condiciones de uso.
Exención de responsabilidad
La información y las publicaciones no constituyen, ni deben considerarse como, asesoramiento o recomendaciones financieras, de inversión, de trading u otro tipo, proporcionadas o respaldadas por TradingView. Obtenga más información en Condiciones de uso.