Auto Trendlines [TheTraderShark]
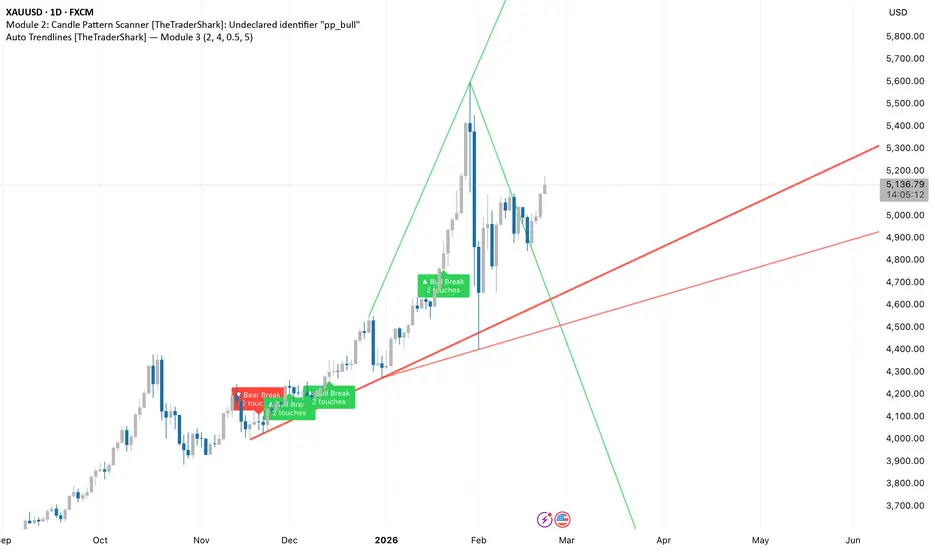
Drawing trendlines by hand is slow. Auto trendline indicators draw too many lines and alert on false breakouts. This one finds the trendlines that matter, scores them by significance, and only alerts when a breakout is confirmed by a candle close — not a wick poke.
Auto Trendlines connects confirmed swing highs to draw resistance trendlines and confirmed swing lows to draw support trendlines. Each line is scored by how many times price has tested it. More touches = more significant. Breakouts only count when a candle closes beyond the line — never on wicks that poke through and reverse. Non-repainting by default.
🦈 FEATURES
▸ Automatic Trendline Drawing
Upper trendlines connect swing highs (resistance). Lower trendlines connect swing lows (support). Lines are drawn from confirmed pivot points and extended forward automatically.
▸ Touch Counting & Significance Scoring
Every time price tests a trendline and respects it, the touch count increments. Trendlines with more touches are displayed with thicker lines — the visual weight matches the significance. A 5-touch trendline stands out against a 2-touch line instantly.
▸ Non-Repainting Breakout Detection
A breakout is confirmed ONLY when a candle CLOSES beyond the trendline:
• Bullish breakout — candle closes above the upper resistance trendline
• Bearish breakout — candle closes below the lower support trendline
Wicks that poke through and reverse are NOT counted as breakouts. This eliminates the false breakout problem that plagues most trendline indicators.
Optional: require above-average volume for additional breakout confirmation.
▸ Broken Trendline Display
When a trendline is broken, you can choose to:
• Hide it — keeps your chart clean
• Show it dashed — broken trendlines often act as support/resistance in the opposite direction (role reversal). Keeping them visible as dashed lines shows these potential reaction zones.
▸ Line Management
Set a maximum number of active trendlines (default: 4 — 2 upper, 2 lower). The indicator automatically removes the oldest, least significant lines when the limit is reached. Your chart never gets cluttered.
🦈 WHY THIS OVER OTHER TRENDLINE INDICATORS
✅ Non-repainting breakouts — alerts and labels only appear on confirmed candle close
✅ Touch counter — instantly see which trendlines are most significant
✅ Significance scoring — line thickness reflects importance
✅ Configurable line limit — no chart clutter
✅ Volume confirmation option — extra filter for high-probability breakouts
✅ Broken line display — see potential role reversal zones
🦈 SETTINGS
🦈 Auto Trendlines
• Enable/Disable — toggle trendline drawing on or off
• Minimum Touches to Show — only display trendlines tested at least this many times (default: 2)
• Show Broken Trendlines — display invalidated trendlines as dashed lines
• Max Active Trendlines — maximum lines on chart at once (default: 4)
• Require Volume for Breakout — only confirm breakouts with above-average volume
🦈 ALERTS
All alerts fire on confirmed bar close only:
• Trendline breakout (bullish) — price closed above resistance trendline. Alert includes touch count.
• Trendline breakout (bearish) — price closed below support trendline. Alert includes touch count.
Example alert message: "Bullish trendline breakout — 4-touch resistance line broken on close"
🦈 HOW TO USE
Add the indicator and let it draw trendlines automatically from swing points.
Pay attention to line thickness — thicker lines have been tested more times and are more significant.
Wait for a breakout that closes beyond the line, not just a wick touch.
Combine with market structure: a bullish trendline breakout during HH+HL structure is a strong continuation signal.
Watch broken trendlines (dashed) — price often retests them as new support or resistance.
Tip: Use minimum 2 touches on 15m-1H charts, minimum 3 touches on daily charts for cleaner output.
🦈 NON-REPAINTING
• Trendlines are drawn from confirmed swing points only (pivot lookback delay)
• Breakouts require candle close beyond the line — wicks are ignored
• No trendline deletion after the fact — once drawn and confirmed, lines stay
• Historical and real-time views match exactly
🦈 ABOUT
Built by TheTraderShark. Part of the Market Structure & Swing Suite — pairs with Swing Detection Engine for the underlying swing data.
Feedback and feature requests welcome in the comments.
Auto Trendlines connects confirmed swing highs to draw resistance trendlines and confirmed swing lows to draw support trendlines. Each line is scored by how many times price has tested it. More touches = more significant. Breakouts only count when a candle closes beyond the line — never on wicks that poke through and reverse. Non-repainting by default.
🦈 FEATURES
▸ Automatic Trendline Drawing
Upper trendlines connect swing highs (resistance). Lower trendlines connect swing lows (support). Lines are drawn from confirmed pivot points and extended forward automatically.
▸ Touch Counting & Significance Scoring
Every time price tests a trendline and respects it, the touch count increments. Trendlines with more touches are displayed with thicker lines — the visual weight matches the significance. A 5-touch trendline stands out against a 2-touch line instantly.
▸ Non-Repainting Breakout Detection
A breakout is confirmed ONLY when a candle CLOSES beyond the trendline:
• Bullish breakout — candle closes above the upper resistance trendline
• Bearish breakout — candle closes below the lower support trendline
Wicks that poke through and reverse are NOT counted as breakouts. This eliminates the false breakout problem that plagues most trendline indicators.
Optional: require above-average volume for additional breakout confirmation.
▸ Broken Trendline Display
When a trendline is broken, you can choose to:
• Hide it — keeps your chart clean
• Show it dashed — broken trendlines often act as support/resistance in the opposite direction (role reversal). Keeping them visible as dashed lines shows these potential reaction zones.
▸ Line Management
Set a maximum number of active trendlines (default: 4 — 2 upper, 2 lower). The indicator automatically removes the oldest, least significant lines when the limit is reached. Your chart never gets cluttered.
🦈 WHY THIS OVER OTHER TRENDLINE INDICATORS
✅ Non-repainting breakouts — alerts and labels only appear on confirmed candle close
✅ Touch counter — instantly see which trendlines are most significant
✅ Significance scoring — line thickness reflects importance
✅ Configurable line limit — no chart clutter
✅ Volume confirmation option — extra filter for high-probability breakouts
✅ Broken line display — see potential role reversal zones
🦈 SETTINGS
🦈 Auto Trendlines
• Enable/Disable — toggle trendline drawing on or off
• Minimum Touches to Show — only display trendlines tested at least this many times (default: 2)
• Show Broken Trendlines — display invalidated trendlines as dashed lines
• Max Active Trendlines — maximum lines on chart at once (default: 4)
• Require Volume for Breakout — only confirm breakouts with above-average volume
🦈 ALERTS
All alerts fire on confirmed bar close only:
• Trendline breakout (bullish) — price closed above resistance trendline. Alert includes touch count.
• Trendline breakout (bearish) — price closed below support trendline. Alert includes touch count.
Example alert message: "Bullish trendline breakout — 4-touch resistance line broken on close"
🦈 HOW TO USE
Add the indicator and let it draw trendlines automatically from swing points.
Pay attention to line thickness — thicker lines have been tested more times and are more significant.
Wait for a breakout that closes beyond the line, not just a wick touch.
Combine with market structure: a bullish trendline breakout during HH+HL structure is a strong continuation signal.
Watch broken trendlines (dashed) — price often retests them as new support or resistance.
Tip: Use minimum 2 touches on 15m-1H charts, minimum 3 touches on daily charts for cleaner output.
🦈 NON-REPAINTING
• Trendlines are drawn from confirmed swing points only (pivot lookback delay)
• Breakouts require candle close beyond the line — wicks are ignored
• No trendline deletion after the fact — once drawn and confirmed, lines stay
• Historical and real-time views match exactly
🦈 ABOUT
Built by TheTraderShark. Part of the Market Structure & Swing Suite — pairs with Swing Detection Engine for the underlying swing data.
Feedback and feature requests welcome in the comments.

Exención de responsabilidad
La información y las publicaciones no constituyen, ni deben considerarse como, asesoramiento o recomendaciones financieras, de inversión, de trading u otro tipo, proporcionadas o respaldadas por TradingView. Obtenga más información en Condiciones de uso.
Exención de responsabilidad
La información y las publicaciones no constituyen, ni deben considerarse como, asesoramiento o recomendaciones financieras, de inversión, de trading u otro tipo, proporcionadas o respaldadas por TradingView. Obtenga más información en Condiciones de uso.