Actualizado
RSI Scaling (UO)
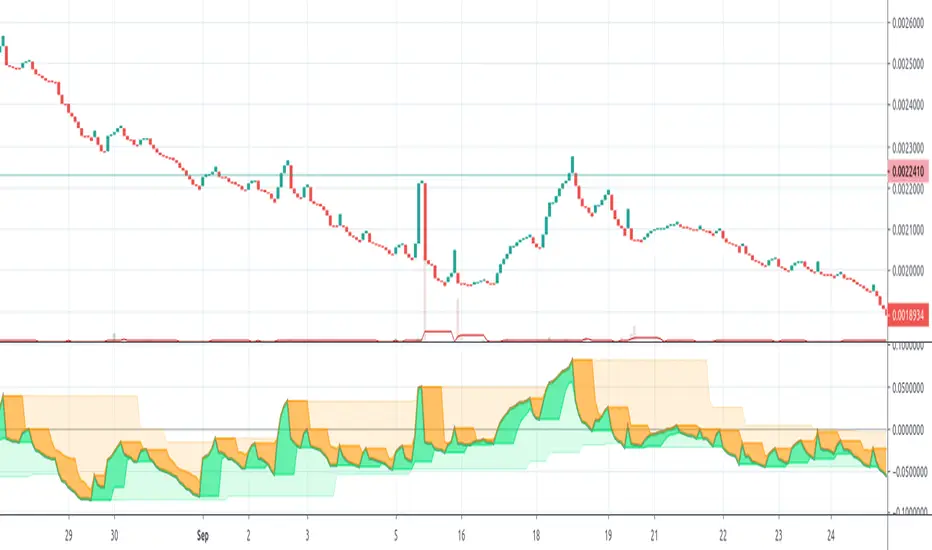
Plot price scaled by the RSI. Also, plot high and low of the scaled price so that the trend is visible as well as sell-high/buy-low points...
Before the prices change direction, RSI generally makes a double top/bottom... Or a lower high/higher low.
This is more emphasized on the scaled price. You can see the high/low band change direction
Before the prices change direction, RSI generally makes a double top/bottom... Or a lower high/higher low.
This is more emphasized on the scaled price. You can see the high/low band change direction
Notas de prensa
The band is color filled to show the trend clearly...Note that while the price can make a higher high, the scaled price can make a lower high. This is a clear sign of reversal. Same for the other direction
Notas de prensa
Added an outer color band to emphasize the highest highs and the lowest lows
Exención de responsabilidad
La información y las publicaciones no constituyen, ni deben considerarse como, asesoramiento o recomendaciones financieras, de inversión, de trading u otro tipo, proporcionadas o respaldadas por TradingView. Obtenga más información en Condiciones de uso.
Exención de responsabilidad
La información y las publicaciones no constituyen, ni deben considerarse como, asesoramiento o recomendaciones financieras, de inversión, de trading u otro tipo, proporcionadas o respaldadas por TradingView. Obtenga más información en Condiciones de uso.