Actualizado
High Time Frame Candle Overlay
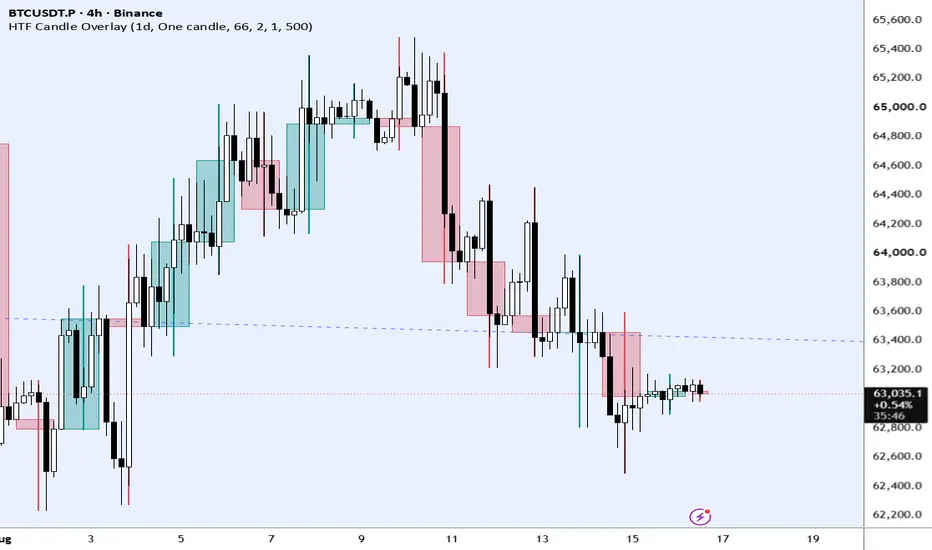
Overlay higher-timeframe (HTF) candles on the same pane as the chart. Each HTF candle spans the lower-timeframe bars that belong to that period, using the same OHLC aggregation as a normal HTF candle: open of the first bar, high/low of the range, close of the last bar (updates while the HTF bar is still forming).
This is a visual overlay only. It does not generate buy or sell signals and is not a trading system.
Why use it
Read the higher-timeframe candle (body, wick, close relative to open) without leaving the working timeframe. Example: on a 15-minute chart, each 1-hour candle covers the four 15-minute bars that form that hour.
Auto HTF (on by default)
The overlay timeframe follows the chart:
Turn Auto HTF from chart off to pick 1m, 5m, 15m, 1h, 4h, 1D, 1W, or 1M manually. The overlay must be higher than the chart timeframe.
Alignment
Period edges follow TradingView session/clock for that timeframe (same boundaries as the built-in HTF chart), not “every N bars from bar 0”.
The right edge stops on the last chart bar of the HTF period (its close), not on the next HTF open. Example: 4h chart + 1D overlay — the daily candle runs from the 08:00 open through the 04:00–08:00 bar close, not through the next day’s 08:00 open.
X uses bar index (stays glued when you pan or the chart auto-fits). Y is price.
Candle styles
Colors and look
Same layout as TradingView candle style: Body, Border, and Wick, each with bull and bear colors (close ≥ open = bull). Color pickers include their own transparency. A separate Transparency input (0–100) sets body fill so the chart candles stay visible underneath.
Also adjustable: wick width, body border width, and how many HTF candles to keep (platform max 500 drawings; Four sections uses more drawings per candle, so the script caps that style at 62).
How to use
Notes
This is a visual overlay only. It does not generate buy or sell signals and is not a trading system.
Why use it
Read the higher-timeframe candle (body, wick, close relative to open) without leaving the working timeframe. Example: on a 15-minute chart, each 1-hour candle covers the four 15-minute bars that form that hour.
Auto HTF (on by default)
The overlay timeframe follows the chart:
- 1m → 5m
- 5m → 15m
- 15m → 1h
- 1h → 4h
- 4h → 1D
- 1D → 1W
- 1W → 1M
Turn Auto HTF from chart off to pick 1m, 5m, 15m, 1h, 4h, 1D, 1W, or 1M manually. The overlay must be higher than the chart timeframe.
Alignment
Period edges follow TradingView session/clock for that timeframe (same boundaries as the built-in HTF chart), not “every N bars from bar 0”.
The right edge stops on the last chart bar of the HTF period (its close), not on the next HTF open. Example: 4h chart + 1D overlay — the daily candle runs from the 08:00 open through the 04:00–08:00 bar close, not through the next day’s 08:00 open.
X uses bar index (stays glued when you pan or the chart auto-fits). Y is price.
Candle styles
- One candle — one body and a center wick (default).
- Four sections — the same HTF OHLC split into four columns, with a wick band in each column so the wick is easier to see against the chart’s own wicks.
Colors and look
Same layout as TradingView candle style: Body, Border, and Wick, each with bull and bear colors (close ≥ open = bull). Color pickers include their own transparency. A separate Transparency input (0–100) sets body fill so the chart candles stay visible underneath.
Also adjustable: wick width, body border width, and how many HTF candles to keep (platform max 500 drawings; Four sections uses more drawings per candle, so the script caps that style at 62).
How to use
- Add the script to a standard candlestick chart (not Heikin Ashi, Renko, or other non-standard types if you need real OHLC).
- Leave Auto HTF on, or turn it off and choose Overlay timeframe.
- Raise Transparency if the overlay hides the chart candles; lower it if the HTF body is too faint.
- Switch to Four sections if the center wick is hard to read.
Notes
- The first HTF candle at the left of loaded history may be a partial period if the first bar is not an HTF boundary.
- Missing chart bars can make the overlay open differ slightly from the exchange HTF print.
- Doji (open = close) uses bull colors, same as TradingView candles.
Notas de prensa
fix D chart display
Exención de responsabilidad
La información y las publicaciones no constituyen, ni deben considerarse como, asesoramiento o recomendaciones financieras, de inversión, de trading u otro tipo, proporcionadas o respaldadas por TradingView. Obtenga más información en Condiciones de uso.
Exención de responsabilidad
La información y las publicaciones no constituyen, ni deben considerarse como, asesoramiento o recomendaciones financieras, de inversión, de trading u otro tipo, proporcionadas o respaldadas por TradingView. Obtenga más información en Condiciones de uso.