OPEN-SOURCE SCRIPT
RCA Relative Volume (RVol)
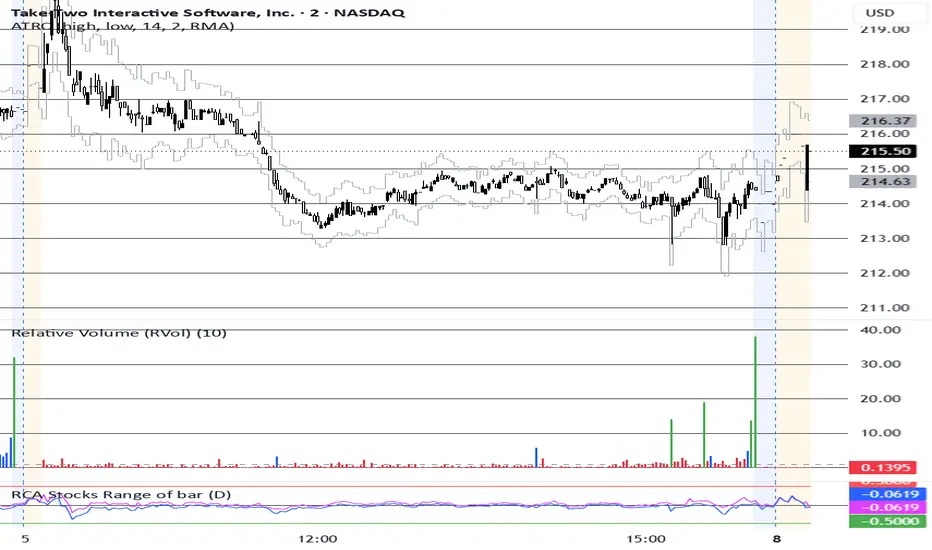
In the financial and trading markets, RVOL stands for Relative Volume. It is a technical indicator that compares the current trading volume of a stock (or other asset) to its average historical volume over a specified period (such as 10, 20, or 30 days). In this case, the average is calculated over the data of the same time of day (ex. 9:45 am current volume vs 10-day 9:45 am average volume).
The Formula= Current Volume/Volume.
RVOL of 1.0: The asset is trading at its exact average volume for that time of day.
RVOL above 2.0: The asset is "in play" and trading at twice its normal volume. This usually signals heightened market interest, increased liquidity, and the potential for large, volatile price movements.
RVOL below 1.0: The asset is experiencing lower-than-average market participation, typically resulting in a quieter, less volatile trading session.
The Formula= Current Volume/Volume.
RVOL of 1.0: The asset is trading at its exact average volume for that time of day.
RVOL above 2.0: The asset is "in play" and trading at twice its normal volume. This usually signals heightened market interest, increased liquidity, and the potential for large, volatile price movements.
RVOL below 1.0: The asset is experiencing lower-than-average market participation, typically resulting in a quieter, less volatile trading session.
Script de código abierto
Fiel al espíritu de TradingView, el creador de este script lo ha convertido en código abierto, para que los traders puedan revisar y verificar su funcionalidad. ¡Enhorabuena al autor! Aunque puede utilizarlo de forma gratuita, recuerde que cualquier republicación del código está sujeta a nuestras Normas internas.

Exención de responsabilidad
La información y las publicaciones no constituyen, ni deben considerarse como, asesoramiento o recomendaciones financieras, de inversión, de trading u otro tipo, proporcionadas o respaldadas por TradingView. Obtenga más información en Condiciones de uso.
Script de código abierto
Fiel al espíritu de TradingView, el creador de este script lo ha convertido en código abierto, para que los traders puedan revisar y verificar su funcionalidad. ¡Enhorabuena al autor! Aunque puede utilizarlo de forma gratuita, recuerde que cualquier republicación del código está sujeta a nuestras Normas internas.
Exención de responsabilidad
La información y las publicaciones no constituyen, ni deben considerarse como, asesoramiento o recomendaciones financieras, de inversión, de trading u otro tipo, proporcionadas o respaldadas por TradingView. Obtenga más información en Condiciones de uso.