OPEN-SOURCE SCRIPT
Actualizado Custom Buy/Sell Indicator
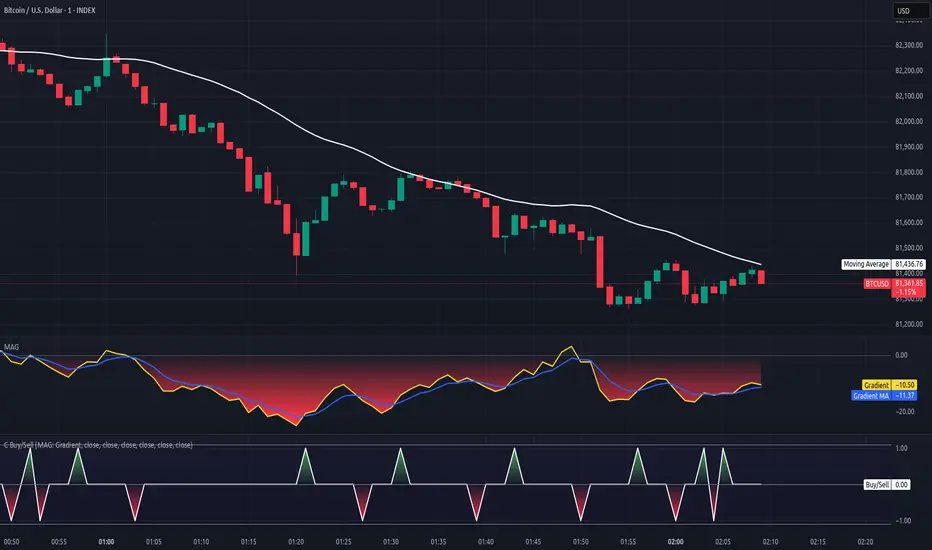
Create you own custom strategies using this 'Custom Buy/Sell Indicator'. It allows other indicators to be combined together into a BUY/SELL strategy, using up to seven separate rules.
It is essentially the same as my 'Simple Buy/Sell Indicator', but combines up to seven rules rather than just four, plus the rules can be combined using various different logical expressions.
There are ten different logical expressions which should cover many common usages, however the list is by no means exhaustive. Should you require a different expression, drop me a comment and I'll try to provide an update.
The output is:
1 = BUY
0 = None
-1 = SELL
This can then be used as an input to my 'Simple Pyramid Strategy' or my 'Complex Single Trade Strategy'.
Each rule compares two values with [< > =]:
Value 1) A source value, or change in that value.
Value 2) An actual value, a percentage of the price of the chart asset, or another source input.
'Bars Back' can be specified if you don't want the latest value. So 1 bar back will give the latest confirmed value.
When the first value is a change, this specifies how far back to test the change for. If the change input is from a higher timeframe, make sure to use the correct value for bars back.
e.g. If the chart is 15 min, but the input change is from an indicator on the 4 hour, bars back needs to be 240 / 15 = 16 bars back.
Inverse rules can optionally be created as well. This means that a BUY strategy will automatically create a SELL strategy, or vice versa, with all the same rules inverted.
When a rule is inverted, the second value is often negated. So x > 4 becomes x < -4. This negation is ALWAYS applied when the first value is a change, but optionally for values.
For comparing two levels, like the price with a moving average, you don't want negation. So price > average, becomes price < average.
However, if the first value is an oscillator, like a MACD signal, you most likely will need negation. So x > 60 becomes x < -60.
For oscillators not zero centred, they will also need an offset to work with negation. e.g. RSI [0 to 100] can be zero centred with an offset of -50 to make it [-50 to +50]
So instead of testing for overbought and oversold with > 70 and < 30, you would offset by -50. Then you would test for > 20 (overbought), which becomes < -20 (oversold) when inverted.
It is essentially the same as my 'Simple Buy/Sell Indicator', but combines up to seven rules rather than just four, plus the rules can be combined using various different logical expressions.
There are ten different logical expressions which should cover many common usages, however the list is by no means exhaustive. Should you require a different expression, drop me a comment and I'll try to provide an update.
The output is:
1 = BUY
0 = None
-1 = SELL
This can then be used as an input to my 'Simple Pyramid Strategy' or my 'Complex Single Trade Strategy'.
Each rule compares two values with [< > =]:
Value 1) A source value, or change in that value.
Value 2) An actual value, a percentage of the price of the chart asset, or another source input.
'Bars Back' can be specified if you don't want the latest value. So 1 bar back will give the latest confirmed value.
When the first value is a change, this specifies how far back to test the change for. If the change input is from a higher timeframe, make sure to use the correct value for bars back.
e.g. If the chart is 15 min, but the input change is from an indicator on the 4 hour, bars back needs to be 240 / 15 = 16 bars back.
Inverse rules can optionally be created as well. This means that a BUY strategy will automatically create a SELL strategy, or vice versa, with all the same rules inverted.
When a rule is inverted, the second value is often negated. So x > 4 becomes x < -4. This negation is ALWAYS applied when the first value is a change, but optionally for values.
For comparing two levels, like the price with a moving average, you don't want negation. So price > average, becomes price < average.
However, if the first value is an oscillator, like a MACD signal, you most likely will need negation. So x > 60 becomes x < -60.
For oscillators not zero centred, they will also need an offset to work with negation. e.g. RSI [0 to 100] can be zero centred with an offset of -50 to make it [-50 to +50]
So instead of testing for overbought and oversold with > 70 and < 30, you would offset by -50. Then you would test for > 20 (overbought), which becomes < -20 (oversold) when inverted.
Notas de prensa
I've added 'crossover', 'crossunder' and 'cross' to the list of operators or comparisons.So now you can get a signal from a source input crossing over a static level, or over another source input.
You can even test for a change in a source input crossing over. e.g. Crossing over 0, so from negative to positive, a negative change meaning falling, crossing over to a positive change meaning rising, which is a bullish reversal.
Likewise, crossing under works in the same way, as does cross, which is both directions.
These crosses also work seamlessly with the rule inversions as well.
Script de código abierto
Fiel al espíritu de TradingView, el creador de este script lo ha convertido en código abierto, para que los traders puedan revisar y verificar su funcionalidad. ¡Enhorabuena al autor! Aunque puede utilizarlo de forma gratuita, recuerde que cualquier republicación del código está sujeta a nuestras Normas internas.

Exención de responsabilidad
La información y las publicaciones no constituyen, ni deben considerarse como, asesoramiento o recomendaciones financieras, de inversión, de trading u otro tipo, proporcionadas o respaldadas por TradingView. Obtenga más información en Condiciones de uso.
Script de código abierto
Fiel al espíritu de TradingView, el creador de este script lo ha convertido en código abierto, para que los traders puedan revisar y verificar su funcionalidad. ¡Enhorabuena al autor! Aunque puede utilizarlo de forma gratuita, recuerde que cualquier republicación del código está sujeta a nuestras Normas internas.
Exención de responsabilidad
La información y las publicaciones no constituyen, ni deben considerarse como, asesoramiento o recomendaciones financieras, de inversión, de trading u otro tipo, proporcionadas o respaldadas por TradingView. Obtenga más información en Condiciones de uso.