OPEN-SOURCE SCRIPT
RSI with Zone Background Fill
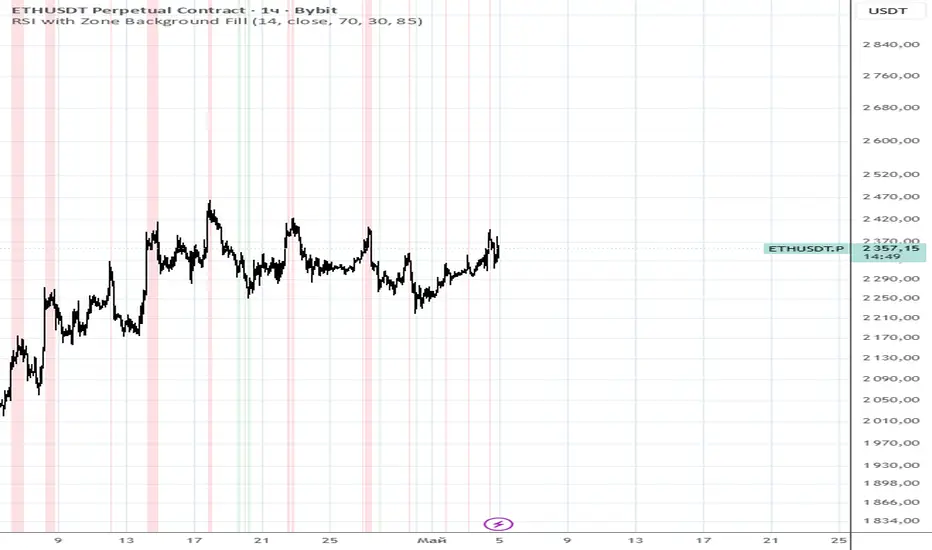
This indicator visually highlights overbought and oversold RSI zones directly on the price chart (since overlay=true).
What it does exactly:
Calculates the standard RSI (period 14, source close).
When RSI is above the specified level (default 70) — the chart background is colored reddish (overbought).
When RSI is below the specified level (default 30) — the background is colored greenish (oversold).
Fill transparency is adjustable (default 85% — barely noticeable).
The RSI line itself is not drawn on the chart (it is only displayed in the Data Window) to avoid cluttering the price chart.
Why it's useful:
To quickly see when the price is in extreme RSI zones without opening a separate indicator window. Convenient for context — for example, to look for reversals or confirm overbought/oversold conditions directly on the candles.https://prnt.sc/LvQLG-ft971R
Script de código abierto
Fiel al espíritu de TradingView, el creador de este script lo ha convertido en código abierto, para que los traders puedan revisar y verificar su funcionalidad. ¡Enhorabuena al autor! Aunque puede utilizarlo de forma gratuita, recuerde que cualquier republicación del código está sujeta a nuestras Normas internas.

Exención de responsabilidad
La información y las publicaciones no constituyen, ni deben considerarse como, asesoramiento o recomendaciones financieras, de inversión, de trading u otro tipo, proporcionadas o respaldadas por TradingView. Obtenga más información en Condiciones de uso.
Script de código abierto
Fiel al espíritu de TradingView, el creador de este script lo ha convertido en código abierto, para que los traders puedan revisar y verificar su funcionalidad. ¡Enhorabuena al autor! Aunque puede utilizarlo de forma gratuita, recuerde que cualquier republicación del código está sujeta a nuestras Normas internas.
Exención de responsabilidad
La información y las publicaciones no constituyen, ni deben considerarse como, asesoramiento o recomendaciones financieras, de inversión, de trading u otro tipo, proporcionadas o respaldadas por TradingView. Obtenga más información en Condiciones de uso.