OPEN-SOURCE SCRIPT
Directional Flow Signals
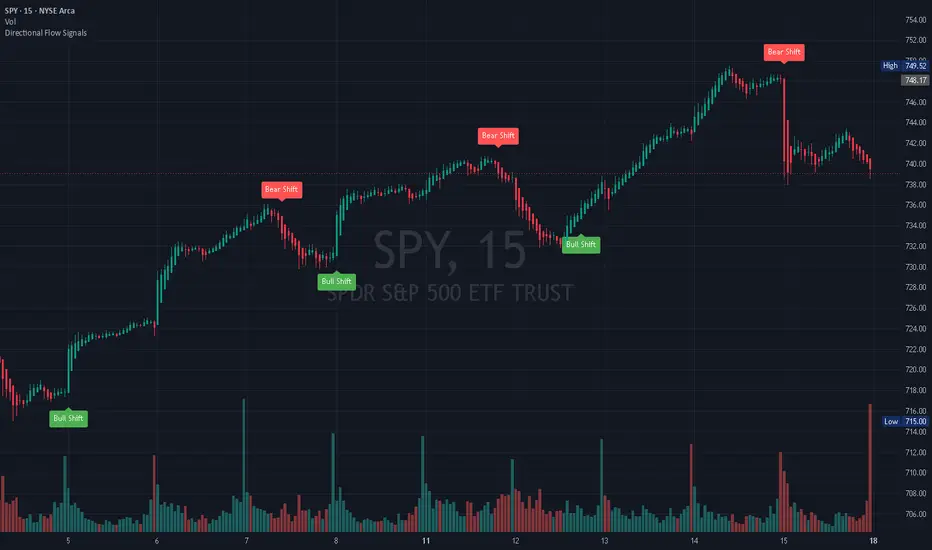
Directional Flow Signals is a DMI-based trend direction indicator designed to highlight shifts in directional pressure directly on the price chart.
The indicator uses the Directional Movement Index system, comparing DI+ and DI- to determine which side of the market is currently dominant.
When DI+ is above DI-, candles are colored bullish.
When DI- is above DI+, candles are colored bearish.
A Long signal appears when directional control shifts from bearish to bullish.
A Short signal appears when directional control shifts from bullish to bearish.
This allows traders to quickly visualize changes in directional bias without needing to keep a separate DMI/ADX panel open.
Key features:
- Bullish and bearish candle coloring
- Long and Short signal labels
- DI+ / DI- crossover-based trend shifts
- Built-in alert conditions
- Adjustable DMI length and smoothing
- Custom candle colors
This tool can be useful for identifying directional transitions, trend bias changes, and possible momentum shifts when combined with support/resistance, volume, VWAP, market structure, or higher timeframe confirmation.
Important:
This indicator does not predict price movement and should not be used as a standalone trading system. Since the signals are based on DI+ and DI- crossovers, they may produce false signals during sideways or low-volatility market conditions.
Inputs:
Show BUY/SELL Signals:
Allows users to enable or disable Long and Short labels on the chart.
ADX Length:
Controls the lookback period used for the Directional Movement Index calculation.
ADX Smoothing:
Controls the smoothing applied to the ADX/DMI calculation.
Up Candle Color:
Sets the candle color when DI+ is stronger than DI-.
Down Candle Color:
Sets the candle color when DI- is stronger than DI+.
Directional Flow Signals is a visual trend-bias indicator based on the Directional Movement Index.
The script compares DI+ and DI- to determine whether bullish or bearish directional pressure is dominant. Candles are colored according to the active directional bias, and signal labels are displayed when the dominant side changes.
Signal logic:
Long Signal:
A Long signal is generated when DI+ becomes stronger than DI- after previously being below it.
Short Signal:
A Short signal is generated when DI- becomes stronger than DI+ after previously being below DI+.
The goal of this indicator is not to predict reversals, but to provide a clear visual representation of directional pressure shifts.
It is best used as a confirmation layer together with price structure, volume, VWAP, support/resistance, or higher timeframe trend analysis.
Limitations:
- Signals are based only on DI+ and DI- dominance.
- The ADX value is calculated but not used as a strength filter.
- False signals may occur in ranging or choppy markets.
- The indicator does not provide stop loss, take profit, or risk management levels.
- It should be used as a confirmation or visual bias tool, not as a complete trading system.
Script de código abierto
Fiel al espíritu de TradingView, el creador de este script lo ha convertido en código abierto, para que los traders puedan revisar y verificar su funcionalidad. ¡Enhorabuena al autor! Aunque puede utilizarlo de forma gratuita, recuerde que cualquier republicación del código está sujeta a nuestras Normas internas.

Exención de responsabilidad
La información y las publicaciones no constituyen, ni deben considerarse como, asesoramiento o recomendaciones financieras, de inversión, de trading u otro tipo, proporcionadas o respaldadas por TradingView. Obtenga más información en Condiciones de uso.
Script de código abierto
Fiel al espíritu de TradingView, el creador de este script lo ha convertido en código abierto, para que los traders puedan revisar y verificar su funcionalidad. ¡Enhorabuena al autor! Aunque puede utilizarlo de forma gratuita, recuerde que cualquier republicación del código está sujeta a nuestras Normas internas.
Exención de responsabilidad
La información y las publicaciones no constituyen, ni deben considerarse como, asesoramiento o recomendaciones financieras, de inversión, de trading u otro tipo, proporcionadas o respaldadas por TradingView. Obtenga más información en Condiciones de uso.