Multi-Timeframe Z-Score Trend [NJ]
✧ OVERVIEW ✧
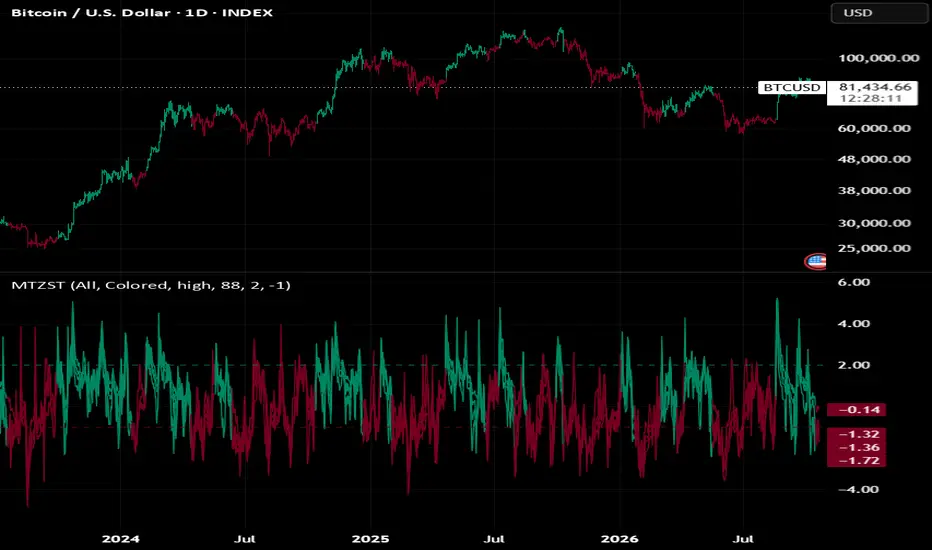
Multi-Timeframe Z-Score Trend is a statistics-based, trend-following oscillator that combines Z-Scores from four higher timeframes into a single average score.
A Z-Score measures how far price is from its recent mean, expressed in standard deviations. It is calculated separately on the 3-hour, 6-hour, 8-hour and 12-hour timeframes, and the four results are averaged.
Separate long and short thresholds applied to the average score are used to identify bullish and bearish conditions. Higher timeframe values are taken only from completed bars, so historical readings do not repaint.

✧ SETTINGS ✧
Display Mode
Switches between showing the average score or all four timeframe Z-Scores.
Color Mode
Switches between colored and neutral visualization.
Color Candles
Shows or hides candle coloring based on the current signal.
Z-Score Source
Selects the price source used for the Z-Score calculation.
Z-Score Length
Controls how many bars of each timeframe are used to calculate the mean and standard deviation.
Long Threshold
Controls the average score required for the indicator to switch to a bullish condition.
Short Threshold
Controls the average score required for the indicator to switch to a bearish condition.
✧ HOW IT WORKS ✧
Z-Score
Mean of selected source is calculated with a simple moving average over Z-Score Length, together with standard deviation over the same period.
Z-Score = (Source − Mean) / Standard Deviation
Positive values indicate that price is above its recent mean, while negative values indicate that it is below.
Multi-Timeframe Calculation
Z-Score is calculated separately on the 3H, 6H, 8H and 12H timeframes using the bars of each timeframe.
Because Z-Score Length is measured in bars of each timeframe, the same length covers a longer period of history on higher timeframes.
For timeframes higher than the chart, the value of the last completed bar is used and only updates when that bar closes.
Average Score
Average Score = (3H + 6H + 8H + 12H) / 4
Combining several timeframes reduces the influence of any single timeframe and highlights moves that are present across all of them.
Signal Logic
A bullish condition is activated when the average score crosses above the Long Threshold.
A bearish condition is activated when the average score crosses below the Short Threshold.
While the average score remains between both thresholds, previous condition stays active.
✧ VISUALIZATION ✧
Oscillator changes color based on the active condition:
Green represents a bullish condition.
Red represents a bearish condition.
Neutral mode displays the same conditions using light and dark shades.
Average mode displays the combined score as a single line. All mode displays the four timeframe Z-Scores as separate lines, while signals are still based on the average score.
Long and short thresholds are plotted as dashed lines in bullish and bearish colors.
Same signal colors can optionally be applied directly to the chart candles.
✧ USAGE ✧
Multi-Timeframe Z-Score Trend can be used to identify:
Bullish and bearish trend conditions
Higher timeframe directional bias
Agreement between multiple timeframes
Potential trend changes
Trend confirmation
Additional confirmation for other technical analysis
Indicator is designed for charts at or below the 3-hour timeframe, where all four calculated timeframes are higher than the chart.
As with any technical indicator, it is best used alongside other forms of analysis rather than as a standalone entry or exit signal.
Multi-Timeframe Z-Score Trend is a statistics-based, trend-following oscillator that combines Z-Scores from four higher timeframes into a single average score.
A Z-Score measures how far price is from its recent mean, expressed in standard deviations. It is calculated separately on the 3-hour, 6-hour, 8-hour and 12-hour timeframes, and the four results are averaged.
Separate long and short thresholds applied to the average score are used to identify bullish and bearish conditions. Higher timeframe values are taken only from completed bars, so historical readings do not repaint.
✧ SETTINGS ✧
Display Mode
Switches between showing the average score or all four timeframe Z-Scores.
Color Mode
Switches between colored and neutral visualization.
Color Candles
Shows or hides candle coloring based on the current signal.
Z-Score Source
Selects the price source used for the Z-Score calculation.
Z-Score Length
Controls how many bars of each timeframe are used to calculate the mean and standard deviation.
Long Threshold
Controls the average score required for the indicator to switch to a bullish condition.
Short Threshold
Controls the average score required for the indicator to switch to a bearish condition.
✧ HOW IT WORKS ✧
Z-Score
Mean of selected source is calculated with a simple moving average over Z-Score Length, together with standard deviation over the same period.
Z-Score = (Source − Mean) / Standard Deviation
Positive values indicate that price is above its recent mean, while negative values indicate that it is below.
Multi-Timeframe Calculation
Z-Score is calculated separately on the 3H, 6H, 8H and 12H timeframes using the bars of each timeframe.
Because Z-Score Length is measured in bars of each timeframe, the same length covers a longer period of history on higher timeframes.
For timeframes higher than the chart, the value of the last completed bar is used and only updates when that bar closes.
Average Score
Average Score = (3H + 6H + 8H + 12H) / 4
Combining several timeframes reduces the influence of any single timeframe and highlights moves that are present across all of them.
Signal Logic
A bullish condition is activated when the average score crosses above the Long Threshold.
A bearish condition is activated when the average score crosses below the Short Threshold.
While the average score remains between both thresholds, previous condition stays active.
✧ VISUALIZATION ✧
Oscillator changes color based on the active condition:
Green represents a bullish condition.
Red represents a bearish condition.
Neutral mode displays the same conditions using light and dark shades.
Average mode displays the combined score as a single line. All mode displays the four timeframe Z-Scores as separate lines, while signals are still based on the average score.
Long and short thresholds are plotted as dashed lines in bullish and bearish colors.
Same signal colors can optionally be applied directly to the chart candles.
✧ USAGE ✧
Multi-Timeframe Z-Score Trend can be used to identify:
Bullish and bearish trend conditions
Higher timeframe directional bias
Agreement between multiple timeframes
Potential trend changes
Trend confirmation
Additional confirmation for other technical analysis
Indicator is designed for charts at or below the 3-hour timeframe, where all four calculated timeframes are higher than the chart.
As with any technical indicator, it is best used alongside other forms of analysis rather than as a standalone entry or exit signal.

Exención de responsabilidad
La información y las publicaciones no constituyen, ni deben considerarse como, asesoramiento o recomendaciones financieras, de inversión, de trading u otro tipo, proporcionadas o respaldadas por TradingView. Obtenga más información en Condiciones de uso.
Exención de responsabilidad
La información y las publicaciones no constituyen, ni deben considerarse como, asesoramiento o recomendaciones financieras, de inversión, de trading u otro tipo, proporcionadas o respaldadas por TradingView. Obtenga más información en Condiciones de uso.