OPEN-SOURCE SCRIPT
MS & RSI Divergences [invincible3]
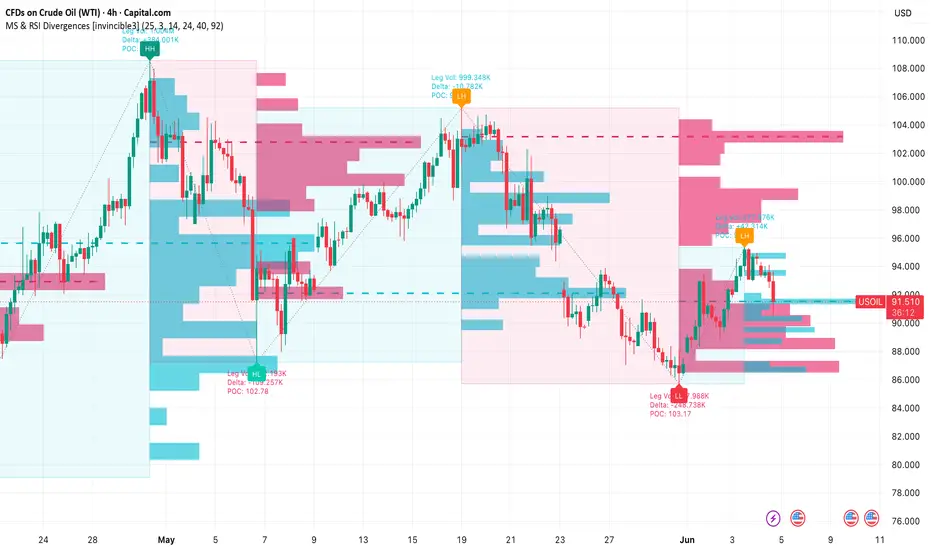
MS & RSI Divergences [invincible3]
MS & RSI Divergences [invincible3] is a market-structure-based trading tool designed to identify key swing highs, swing lows, RSI regular divergences, and swing-based volume profile zones directly on the main chart.
This indicator combines price action structure, momentum divergence, and volume distribution into one visual framework, helping traders analyze whether price movement is supported or weakened by momentum and volume.
The script detects confirmed pivot highs and lows using user-defined left and right lookback bars, then classifies each swing as:
HH — Higher High
LH — Lower High
HL — Higher Low
LL — Lower Low
It also draws a dotted ZigZag between confirmed swings, making the overall market structure easier to read. The active swing is dynamically updated, so if another stronger high or lower low appears before the opposite pivot forms, the script keeps only the strongest valid swing. This helps reduce duplicate or weak swing labels and keeps the chart cleaner.
Key Features
1. Market Structure Detection
The indicator automatically identifies major swing points and labels them as HH, LH, HL, or LL. This helps traders quickly understand whether the market is forming bullish continuation, bearish continuation, or possible reversal structure.
A sequence of HH + HL usually reflects bullish structure, while LH + LL usually reflects bearish structure.
2. RSI Regular Divergence
The indicator uses RSI to detect regular divergences at confirmed swing points.
A bearish divergence is detected when price forms a higher high, but RSI forms a lower high. This can suggest weakening bullish momentum.
A bullish divergence is detected when price forms a lower low, but RSI forms a higher low. This can suggest weakening bearish momentum.
Divergence lines are drawn directly on price, with a “D” label marking the divergence area.
3. Swing Volume Profile
For each completed swing leg, the indicator can draw a volume profile between the previous swing and the current swing.
This shows where the most trading activity occurred inside that swing range. The profile also includes a dashed POC line, which represents the price level with the highest volume concentration inside the swing.
This can help identify important reaction zones, support/resistance areas, and volume-based decision levels.
4. Leg Statistics
The indicator can display swing-leg statistics, including:
Total leg volume
Volume delta approximation
POC price
The delta is estimated using candle direction, where bullish candles contribute positive volume and bearish candles contribute negative volume.
Main Settings
Market Structure Settings
Left Bars Lookback controls how many bars are checked on the left side of a pivot.
Right Bars Lookback controls how many bars are required after a pivot before it is confirmed.
Show MS Labels enables or disables HH, LH, HL, and LL labels.
Show Dotted ZigZag enables or disables the dotted swing connection line.
RSI Divergence Settings
Show Regular Divergences enables or disables RSI divergence detection.
RSI Length controls the RSI calculation period.
You can also customize bullish and bearish divergence colors.
Swing Volume Profile Settings
Show Swing Volume Profiles enables or disables the volume profile for each swing.
Profile Granularity controls the number of volume rows.
Profile Width controls how far the profile extends to the right.
Show Leg Stats displays volume, delta, and POC information.
Background Transparency controls the visibility of the profile background box.
How to Use
Use the market structure labels to understand the current trend direction.
Use RSI divergence signals near HH, LH, HL, or LL areas to detect possible momentum weakness.
Use the swing volume profile and POC line to find price zones where volume was concentrated.
For stronger confirmation, combine this indicator with support/resistance, trendlines, higher-timeframe bias, or your own trading system.
Important Notes
This indicator uses pivot-based logic, so swing labels appear only after the required right-side confirmation bars have closed.
The active swing can update until the opposite swing is confirmed. This is intentional because the script keeps the strongest high or lowest low before a new opposite pivot appears.
This tool is designed for analysis and decision support. It should not be used alone as a buy or sell signal.
Best Used For
Price action analysis
Market structure reading
RSI divergence detection
Swing trading
Trend reversal analysis
Support and resistance confirmation
Volume profile-based swing analysis
Disclaimer
This indicator is for educational and analytical purposes only. It does not guarantee future price movement. Always use proper risk management and confirm signals with your own trading strategy before making trading decisions.
MS & RSI Divergences [invincible3] is a market-structure-based trading tool designed to identify key swing highs, swing lows, RSI regular divergences, and swing-based volume profile zones directly on the main chart.
This indicator combines price action structure, momentum divergence, and volume distribution into one visual framework, helping traders analyze whether price movement is supported or weakened by momentum and volume.
The script detects confirmed pivot highs and lows using user-defined left and right lookback bars, then classifies each swing as:
HH — Higher High
LH — Lower High
HL — Higher Low
LL — Lower Low
It also draws a dotted ZigZag between confirmed swings, making the overall market structure easier to read. The active swing is dynamically updated, so if another stronger high or lower low appears before the opposite pivot forms, the script keeps only the strongest valid swing. This helps reduce duplicate or weak swing labels and keeps the chart cleaner.
Key Features
1. Market Structure Detection
The indicator automatically identifies major swing points and labels them as HH, LH, HL, or LL. This helps traders quickly understand whether the market is forming bullish continuation, bearish continuation, or possible reversal structure.
A sequence of HH + HL usually reflects bullish structure, while LH + LL usually reflects bearish structure.
2. RSI Regular Divergence
The indicator uses RSI to detect regular divergences at confirmed swing points.
A bearish divergence is detected when price forms a higher high, but RSI forms a lower high. This can suggest weakening bullish momentum.
A bullish divergence is detected when price forms a lower low, but RSI forms a higher low. This can suggest weakening bearish momentum.
Divergence lines are drawn directly on price, with a “D” label marking the divergence area.
3. Swing Volume Profile
For each completed swing leg, the indicator can draw a volume profile between the previous swing and the current swing.
This shows where the most trading activity occurred inside that swing range. The profile also includes a dashed POC line, which represents the price level with the highest volume concentration inside the swing.
This can help identify important reaction zones, support/resistance areas, and volume-based decision levels.
4. Leg Statistics
The indicator can display swing-leg statistics, including:
Total leg volume
Volume delta approximation
POC price
The delta is estimated using candle direction, where bullish candles contribute positive volume and bearish candles contribute negative volume.
Main Settings
Market Structure Settings
Left Bars Lookback controls how many bars are checked on the left side of a pivot.
Right Bars Lookback controls how many bars are required after a pivot before it is confirmed.
Show MS Labels enables or disables HH, LH, HL, and LL labels.
Show Dotted ZigZag enables or disables the dotted swing connection line.
RSI Divergence Settings
Show Regular Divergences enables or disables RSI divergence detection.
RSI Length controls the RSI calculation period.
You can also customize bullish and bearish divergence colors.
Swing Volume Profile Settings
Show Swing Volume Profiles enables or disables the volume profile for each swing.
Profile Granularity controls the number of volume rows.
Profile Width controls how far the profile extends to the right.
Show Leg Stats displays volume, delta, and POC information.
Background Transparency controls the visibility of the profile background box.
How to Use
Use the market structure labels to understand the current trend direction.
Use RSI divergence signals near HH, LH, HL, or LL areas to detect possible momentum weakness.
Use the swing volume profile and POC line to find price zones where volume was concentrated.
For stronger confirmation, combine this indicator with support/resistance, trendlines, higher-timeframe bias, or your own trading system.
Important Notes
This indicator uses pivot-based logic, so swing labels appear only after the required right-side confirmation bars have closed.
The active swing can update until the opposite swing is confirmed. This is intentional because the script keeps the strongest high or lowest low before a new opposite pivot appears.
This tool is designed for analysis and decision support. It should not be used alone as a buy or sell signal.
Best Used For
Price action analysis
Market structure reading
RSI divergence detection
Swing trading
Trend reversal analysis
Support and resistance confirmation
Volume profile-based swing analysis
Disclaimer
This indicator is for educational and analytical purposes only. It does not guarantee future price movement. Always use proper risk management and confirm signals with your own trading strategy before making trading decisions.
Script de código abierto
Fiel al espíritu de TradingView, el creador de este script lo ha convertido en código abierto, para que los traders puedan revisar y verificar su funcionalidad. ¡Enhorabuena al autor! Aunque puede utilizarlo de forma gratuita, recuerde que cualquier republicación del código está sujeta a nuestras Normas internas.

Exención de responsabilidad
La información y las publicaciones no constituyen, ni deben considerarse como, asesoramiento o recomendaciones financieras, de inversión, de trading u otro tipo, proporcionadas o respaldadas por TradingView. Obtenga más información en Condiciones de uso.
Script de código abierto
Fiel al espíritu de TradingView, el creador de este script lo ha convertido en código abierto, para que los traders puedan revisar y verificar su funcionalidad. ¡Enhorabuena al autor! Aunque puede utilizarlo de forma gratuita, recuerde que cualquier republicación del código está sujeta a nuestras Normas internas.
Exención de responsabilidad
La información y las publicaciones no constituyen, ni deben considerarse como, asesoramiento o recomendaciones financieras, de inversión, de trading u otro tipo, proporcionadas o respaldadas por TradingView. Obtenga más información en Condiciones de uso.