OPEN-SOURCE SCRIPT
Actualizado Previous Day/Week/Month High/Low
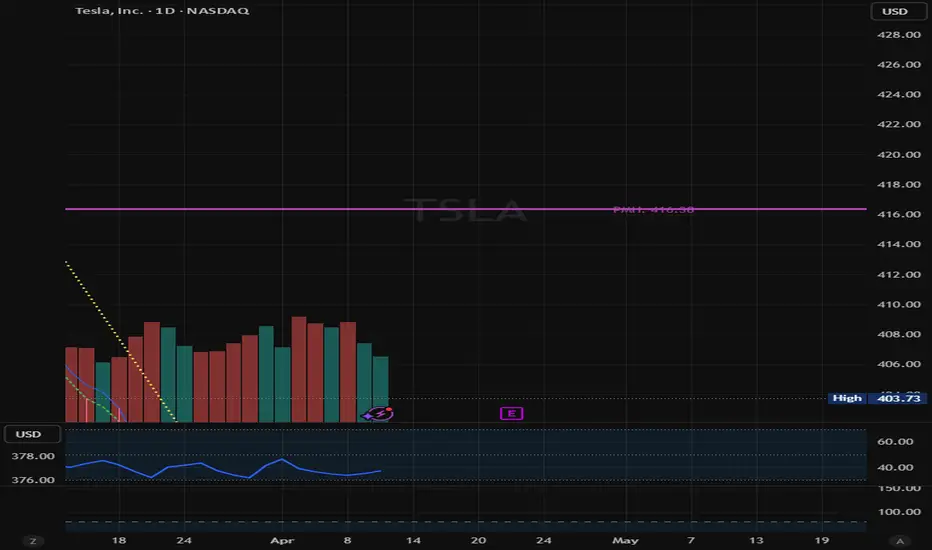
This script plots the previous day, week and month high and low.
Notas de prensa
//version=6indicator("True Anchor H/L - Always-On Build", overlay=true, max_bars_back=5000)
// --- HELPER FUNCTION: Convert String to Line Style ---
getStyle(s) =>
s == "Dashed" ? line.style_dashed : s == "Dotted" ? line.style_dotted : line.style_solid
// --- GUI INPUTS ---
grp_g = "Global Settings"
label_off = input.int(6, "Label Vertical Offset (Ticks)", minval=0, group=grp_g)
// 10-Minute
grp_10 = "10-Minute Levels"
show_10 = input.bool(true, "Show P10mH/P10mL", group=grp_10)
col_10 = input.color(#9598a1, "Color", group=grp_10)
wid_10 = input.int(1, "Weight", minval=1, maxval=5, group=grp_10)
sty_10 = input.string("Solid", "Style", options=["Solid", "Dashed", "Dotted"], group=grp_10)
// Hourly
grp_h = "Hour Levels"
show_h = input.bool(true, "Show PHH/PHL", group=grp_h)
col_h = input.color(#ff9800, "Color", group=grp_h)
wid_h = input.int(1, "Weight", minval=1, maxval=5, group=grp_h)
sty_h = input.string("Solid", "Style", options=["Solid", "Dashed", "Dotted"], group=grp_h)
// Daily
grp_d = "Daily Levels"
show_d = input.bool(true, "Show Daily PDH/PDL", group=grp_d)
col_d = input.color(#86c7e6, "Color", group=grp_d)
wid_d = input.int(1, "Weight", minval=1, maxval=5, group=grp_d)
sty_d = input.string("Solid", "Style", options=["Solid", "Dashed", "Dotted"], group=grp_d)
// Weekly
grp_w = "Weekly Levels"
show_w = input.bool(true, "Show PWH/PWL", group=grp_w)
col_w = input.color(#e4bec4, "Color", group=grp_w)
wid_w = input.int(2, "Weight", minval=1, maxval=5, group=grp_w)
sty_w = input.string("Solid", "Style", options=["Solid", "Dashed", "Dotted"], group=grp_w)
// Monthly
grp_m = "Monthly Levels"
show_m = input.bool(true, "Show Monthly PMH/PML", group=grp_m)
col_m = input.color(#ac43ac, "Color", group=grp_m)
wid_m = input.int(2, "Weight", minval=1, maxval=5, group=grp_m)
sty_m = input.string("Solid", "Style", options=["Solid", "Dashed", "Dotted"], group=grp_m)
// --- 1. Fetch Price Levels ---
p10h = request.security(syminfo.tickerid, "10", high[1], lookahead=barmerge.lookahead_on)
p10l = request.security(syminfo.tickerid, "10", low[1], lookahead=barmerge.lookahead_on)
phh = request.security(syminfo.tickerid, "60", high[1], lookahead=barmerge.lookahead_on)
phl = request.security(syminfo.tickerid, "60", low[1], lookahead=barmerge.lookahead_on)
phd = request.security(syminfo.tickerid, "D", high[1], lookahead=barmerge.lookahead_on)
pld = request.security(syminfo.tickerid, "D", low[1], lookahead=barmerge.lookahead_on)
phw = request.security(syminfo.tickerid, "W", high[1], lookahead=barmerge.lookahead_on)
plw = request.security(syminfo.tickerid, "W", low[1], lookahead=barmerge.lookahead_on)
phm = request.security(syminfo.tickerid, "M", high[1], lookahead=barmerge.lookahead_on)
plm = request.security(syminfo.tickerid, "M", low[1], lookahead=barmerge.lookahead_on)
// --- 2. Anchoring Logic ---
tenMinAnchor = ta.valuewhen(ta.change(time("10")) != 0, bar_index, 1)
hourAnchor = ta.valuewhen(ta.change(time("60")) != 0, bar_index, 1)
dayAnchor = ta.valuewhen(ta.change(time("D")) != 0, bar_index, 1)
weekAnchor = ta.valuewhen(ta.change(time("W")) != 0, bar_index, 1)
monthAnchor = ta.valuewhen(ta.change(time("M")) != 0, bar_index, 1)
// --- 3. Drawing Function ---
drawLevel(anchorBar, price, useColor, width, styleStr, labelText, xOffset, isVisible) =>
if isVisible and not na(price) and not na(anchorBar)
int startX = int(anchorBar)
int endX = bar_index
if startX >= endX
startX := endX - 1
line.new(startX, price, endX, price, xloc.bar_index, extend.right, useColor, style=getStyle(styleStr), width=width, force_overlay=true)
float labelY = price - (syminfo.mintick * label_off)
label.new(x=endX + xOffset, y=labelY, text=labelText, xloc=xloc.bar_index, color=color(na), textcolor=useColor, style=label.style_label_left, size=size.small, force_overlay=true)
// --- 4. Execution ---
if barstate.islast
// Cleanup
line_arr = line.all
if array.size(line_arr) > 0
for i = 0 to array.size(line_arr) - 1
line.delete(array.get(line_arr, i))
label_arr = label.all
if array.size(label_arr) > 0
for i = 0 to array.size(label_arr) - 1
label.delete(array.get(label_arr, i))
// Render Logic (Filters removed to ensure visibility on all timeframes)
drawLevel(tenMinAnchor, p10h, col_10, wid_10, sty_10, "P10mH", 1, show_10)
drawLevel(tenMinAnchor, p10l, col_10, wid_10, sty_10, "P10mL", 1, show_10)
drawLevel(hourAnchor, phh, col_h, wid_h, sty_h, "PHH", 4, show_h)
drawLevel(hourAnchor, phl, col_h, wid_h, sty_h, "PHL", 4, show_h)
drawLevel(dayAnchor, phd, col_d, wid_d, sty_d, "PDH", 7, show_d)
drawLevel(dayAnchor, pld, col_d, wid_d, sty_d, "PDL", 7, show_d)
drawLevel(weekAnchor, phw, col_w, wid_w, sty_w, "PWH", 10, show_w)
drawLevel(weekAnchor, plw, col_w, wid_w, sty_w, "PWL", 10, show_w)
drawLevel(monthAnchor, phm, col_m, wid_m, sty_m, "PMH", 13, show_m)
drawLevel(monthAnchor, plm, col_m, wid_m, sty_m, "PML", 13, show_m)
Notas de prensa
This will help you plot previous high timeframe levels automatically.you can change line style, weight and text placement.
this will only show smaller time frames when you go to that time frame (i.e. the 1H will only show the 1D, 1W and 1M levels while the 10m frame will also plot the 10m levels)
Notas de prensa
.Script de código abierto
Fiel al espíritu de TradingView, el creador de este script lo ha convertido en código abierto, para que los traders puedan revisar y verificar su funcionalidad. ¡Enhorabuena al autor! Aunque puede utilizarlo de forma gratuita, recuerde que cualquier republicación del código está sujeta a nuestras Normas internas.

Exención de responsabilidad
La información y las publicaciones no constituyen, ni deben considerarse como, asesoramiento o recomendaciones financieras, de inversión, de trading u otro tipo, proporcionadas o respaldadas por TradingView. Obtenga más información en Condiciones de uso.
Script de código abierto
Fiel al espíritu de TradingView, el creador de este script lo ha convertido en código abierto, para que los traders puedan revisar y verificar su funcionalidad. ¡Enhorabuena al autor! Aunque puede utilizarlo de forma gratuita, recuerde que cualquier republicación del código está sujeta a nuestras Normas internas.
Exención de responsabilidad
La información y las publicaciones no constituyen, ni deben considerarse como, asesoramiento o recomendaciones financieras, de inversión, de trading u otro tipo, proporcionadas o respaldadas por TradingView. Obtenga más información en Condiciones de uso.