Actualizado
Titpaud ICT
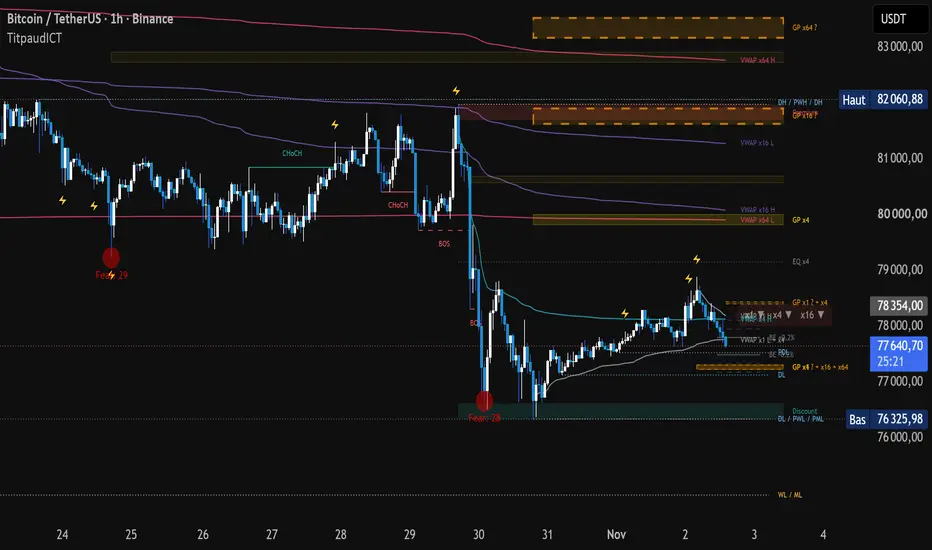
Titpaud ICT
A clean, multi-layer ICT / smart money visual aid. It does not give entries or exits: it shows where the market structure, the golden pockets, the untaken liquidity and your break-even sit, on one chart, without loading other timeframes.
ORIGINALITY
- Original code, written from scratch. The ICT concepts it draws (market structure, golden pocket, premium / discount, sweeps, equal highs / lows) are public; the premium / discount display limited to the extremes of the range follows a common SMC convention.
- Four swing layers on the chart timeframe: x1, x4, x16 and x64. Larger layers use larger swing thresholds instead of requesting higher timeframes, so everything is computed on the chart data and is fast.
- Swings by amplitude (default): a swing high is confirmed as soon as the price comes back k x ATR(50) below it (a swing low: k x ATR(50) above it), however many bars it takes. One strong reversal candle is enough. The x4 / x16 / x64 layers use 2k, 4k and 8k, because moves grow roughly like the square root of time (a timeframe 4 times larger moves about 2 times more). The classic mode (pivots with a fixed number of bars on each side) remains available.
- Unconfirmed golden pockets: the golden pocket of the swing in progress, before its end is confirmed, so you can see where the retracement zone would be if the reversal starts now.
- Untaken previous day / week / month highs and lows drawn from their exact bar, not only the previous day.
- Break-even lines around the price, from your entry and exit fees.
WHAT IT SHOWS
1. Golden pockets (yellow): 0.618 - 0.65 retracement (adjustable, e.g. 0.62 - 0.79 for the OTE) of the last swing of each layer, plus past ones. Overlapping layers look darker and share one label ("GP x4 + x16"). A golden pocket disappears once a wick has crossed it completely (beyond its far edge) and, optionally, once a close breaks the start of its swing.
2. Unconfirmed golden pockets (orange, dashed, label "GP x4 ?"): last confirmed swing -> extreme reached since then, and that extreme -> the move back from it. They move with the price until the swing is confirmed, then the yellow golden pocket takes over.
3. Market structure: BOS (dashed) and CHoCH (solid) of the x1 layer, on the same swings as the golden pockets (or on pivots). A trend label shows the x1 / x4 / x16 trends; it turns green or red when the three agree.
4. Equal highs / lows (EQH / EQL): two swings within a fraction of the ATR(200). The line disappears when a wick takes it.
5. Previous highs / lows still untaken: day (D), week (W) and month (M), the nearest ones on each side of the price. "P" marks the period that just closed (PDH, PWL...). A level disappears when a wick takes it. Levels at nearly the same price share one label ("DL / PWL"). Hover a label to read the date and price.
6. Break-even lines: above and below the price, where a long or a short opened now (or at your entry price) pays both fees. Optional lines at 2x and 3x.
7. Premium / discount (option): range between the last swing high and low of a chosen layer, widened by any new high or low reached since (before it is confirmed as a swing); only its top (premium, red) and bottom (discount, green) extremes are colored (5 % by default), with a dotted equilibrium line at 50 %.
8. Sweeps (lightning bolt): a wick goes beyond a swing and the bar closes back inside. Choose which layers count (only x16 by default, to keep the chart light) and whether sweeps of previous D / W / M levels count. One bolt per swing. Hover the bolt to see what was swept.
ALERTS
Two ways, use either:
- One alert with "Any alert() function call": a detailed message per bar close (layers, levels, prices). Choose the events in the "Alerts" group: premium / discount zone entered and golden pocket entered (both on by default), sweep inside a golden pocket, overlapping golden pockets entered, sweep, CHoCH (layer x1 / x4 / x16), trend alignment, previous D / W / M level taken, equal highs / lows taken.
- Or pick one event at a time in the alert window ("GP entered", "Sweep in GP", "Premium entered", "Bullish CHoCH"...), with a fixed message.
Golden pocket alerts only concern the layers displayed.
HOW TO USE IT
Use it as a map: the golden pockets of several layers, the untaken previous highs / lows and the equal highs / lows are areas where a reaction or a liquidity grab is more likely to be watched by traders. Combine it with your own trigger (momentum, divergence, order flow). The break-even lines show at a glance how far the price must move before a trade covers its fees.
Main settings: "Reversal size x1" (k, default 2 x ATR50) controls how big a swing must be; lower it for more, smaller swings. The ON / OFF group at the top switches each element.
LIMITS - PLEASE READ
- Swings are confirmed after the fact (once the price has come back k x ATR, or "length" bars later in pivot mode). They are then drawn at their exact past bar: drawings appear later than the swing itself. Unconfirmed golden pockets move with the price by design.
- Drawings are computed on the last bar to stay light; golden pocket and premium / discount alerts are evaluated in real time only and cannot be replayed on history. TradingView may show a repaint warning when you create an alert for this reason; alerts fire once per bar close.
- The x64 layer needs a long history; on a short history it may show nothing.
- This is a visual aid, not a trading system. No performance is claimed: the zones it draws have no proven edge on their own.
A clean, multi-layer ICT / smart money visual aid. It does not give entries or exits: it shows where the market structure, the golden pockets, the untaken liquidity and your break-even sit, on one chart, without loading other timeframes.
ORIGINALITY
- Original code, written from scratch. The ICT concepts it draws (market structure, golden pocket, premium / discount, sweeps, equal highs / lows) are public; the premium / discount display limited to the extremes of the range follows a common SMC convention.
- Four swing layers on the chart timeframe: x1, x4, x16 and x64. Larger layers use larger swing thresholds instead of requesting higher timeframes, so everything is computed on the chart data and is fast.
- Swings by amplitude (default): a swing high is confirmed as soon as the price comes back k x ATR(50) below it (a swing low: k x ATR(50) above it), however many bars it takes. One strong reversal candle is enough. The x4 / x16 / x64 layers use 2k, 4k and 8k, because moves grow roughly like the square root of time (a timeframe 4 times larger moves about 2 times more). The classic mode (pivots with a fixed number of bars on each side) remains available.
- Unconfirmed golden pockets: the golden pocket of the swing in progress, before its end is confirmed, so you can see where the retracement zone would be if the reversal starts now.
- Untaken previous day / week / month highs and lows drawn from their exact bar, not only the previous day.
- Break-even lines around the price, from your entry and exit fees.
WHAT IT SHOWS
1. Golden pockets (yellow): 0.618 - 0.65 retracement (adjustable, e.g. 0.62 - 0.79 for the OTE) of the last swing of each layer, plus past ones. Overlapping layers look darker and share one label ("GP x4 + x16"). A golden pocket disappears once a wick has crossed it completely (beyond its far edge) and, optionally, once a close breaks the start of its swing.
2. Unconfirmed golden pockets (orange, dashed, label "GP x4 ?"): last confirmed swing -> extreme reached since then, and that extreme -> the move back from it. They move with the price until the swing is confirmed, then the yellow golden pocket takes over.
3. Market structure: BOS (dashed) and CHoCH (solid) of the x1 layer, on the same swings as the golden pockets (or on pivots). A trend label shows the x1 / x4 / x16 trends; it turns green or red when the three agree.
4. Equal highs / lows (EQH / EQL): two swings within a fraction of the ATR(200). The line disappears when a wick takes it.
5. Previous highs / lows still untaken: day (D), week (W) and month (M), the nearest ones on each side of the price. "P" marks the period that just closed (PDH, PWL...). A level disappears when a wick takes it. Levels at nearly the same price share one label ("DL / PWL"). Hover a label to read the date and price.
6. Break-even lines: above and below the price, where a long or a short opened now (or at your entry price) pays both fees. Optional lines at 2x and 3x.
7. Premium / discount (option): range between the last swing high and low of a chosen layer, widened by any new high or low reached since (before it is confirmed as a swing); only its top (premium, red) and bottom (discount, green) extremes are colored (5 % by default), with a dotted equilibrium line at 50 %.
8. Sweeps (lightning bolt): a wick goes beyond a swing and the bar closes back inside. Choose which layers count (only x16 by default, to keep the chart light) and whether sweeps of previous D / W / M levels count. One bolt per swing. Hover the bolt to see what was swept.
ALERTS
Two ways, use either:
- One alert with "Any alert() function call": a detailed message per bar close (layers, levels, prices). Choose the events in the "Alerts" group: premium / discount zone entered and golden pocket entered (both on by default), sweep inside a golden pocket, overlapping golden pockets entered, sweep, CHoCH (layer x1 / x4 / x16), trend alignment, previous D / W / M level taken, equal highs / lows taken.
- Or pick one event at a time in the alert window ("GP entered", "Sweep in GP", "Premium entered", "Bullish CHoCH"...), with a fixed message.
Golden pocket alerts only concern the layers displayed.
HOW TO USE IT
Use it as a map: the golden pockets of several layers, the untaken previous highs / lows and the equal highs / lows are areas where a reaction or a liquidity grab is more likely to be watched by traders. Combine it with your own trigger (momentum, divergence, order flow). The break-even lines show at a glance how far the price must move before a trade covers its fees.
Main settings: "Reversal size x1" (k, default 2 x ATR50) controls how big a swing must be; lower it for more, smaller swings. The ON / OFF group at the top switches each element.
LIMITS - PLEASE READ
- Swings are confirmed after the fact (once the price has come back k x ATR, or "length" bars later in pivot mode). They are then drawn at their exact past bar: drawings appear later than the swing itself. Unconfirmed golden pockets move with the price by design.
- Drawings are computed on the last bar to stay light; golden pocket and premium / discount alerts are evaluated in real time only and cannot be replayed on history. TradingView may show a repaint warning when you create an alert for this reason; alerts fire once per bar close.
- The x64 layer needs a long history; on a short history it may show nothing.
- This is a visual aid, not a trading system. No performance is claimed: the zones it draws have no proven edge on their own.
Notas de prensa
Update - golden pockets and new defaultsGolden pockets
- Past golden pockets now keep running to the right as long as they are not filled (no wick has crossed them completely). Before, they stopped where the next swing started. Filled ones are removed; up to 6 unfilled past golden pockets are kept per layer.
- New style settings: display (border and fill, border only, fill only), border style (solid, dashed, dotted), border width, border color, fill transparency (0 to 100). The former "Color" setting is now "Fill color".
- Borders are barely visible by default (20 % opacity); past golden pockets are slightly lighter.
Premium / discount
- The range now follows a new high or low that is not confirmed as a swing yet, so the price can no longer sit outside the range.
New default settings
- Reversal size x1: 3 x ATR50 (was 2): fewer, more meaningful swings (x4 / x16 / x64 = 6, 12, 24 x ATR50).
- Equal highs / lows tolerance: 0.2 x ATR200 (was 0.1).
- Premium / discount: on.
- Sweeps: x16 and x64 swings, plus previous D / W / M highs / lows.
- Alerts: all alert types on.
Note: TradingView keeps the settings of an indicator already on the chart. Use "Reset settings" (or remove and add the indicator again) to get the new defaults.
Notas de prensa
Update - transparency fix and sweep optionsFix
- Break-even lines: the transparency chosen in the "Color" setting was ignored (the script forced its own value), so changing the opacity had no effect. The colors are now used exactly as set.
Changes
- Break-even lines: two color settings, one for the lines at the fees ("Color (fee lines)", 40 % opacity by default) and one for the 2x / 3x lines ("Color (2x / 3x lines)", 10 % opacity by default).
- Trend label (x1 / x4 / x16): new settings for the background transparency (90 by default, nearly invisible) and the text transparency (50 by default), in the Structure group.
- Sweeps: the sweeps of previous highs / lows can now be chosen per period: day, week and month, each with its own box (all on by default). A period needs its levels on in "Previous highs / lows".
Note: use "Reset settings" (or remove and add the indicator again) to get the new defaults.
Notas de prensa
Titpaud ICT v2.6- New: anchored VWAPs. A volume weighted average price starts at the last swing high and at the last swing low of each layer (the same swings as the golden pockets). One box per layer: x16 and x64 are on by default, x1 and x4 are off. Option "Last swing only" keeps one VWAP per layer, from its most recent swing. Optional standard deviation bands, one color per layer, labels "VWAP x16 H" / "VWAP x64 L" (hover a label for the swing date and the value). The ON / OFF group has a new "Anchored VWAPs" box.
- Fix: runtime error RE10026 ("left argument in box.new() is too far from the current bar index"). It happened when an old unfilled golden pocket, or another drawing, started more than 10,000 bars back. Such drawings now start 10,000 bars back at most.
- The 2x / 3x break-even lines are at 20 % opacity by default (they were at 10 %).
After the update, use "Reset settings" in the indicator settings to get the new defaults.
Notas de prensa
Titpaud ICT v2.7- Fix: runtime error "requested historical offset is beyond the historical buffer's limit". Old drawings (golden pockets, premium / discount, structure, equal highs / lows) now start 4,999 bars back at most.
- Anchored VWAPs: color (with its transparency), width and line style (solid, dashed, dotted) can now be set layer by layer, on one row per layer (x1, x4, x16, x64).
After the update, use "Reset settings" in the indicator settings to get the new defaults.

Exención de responsabilidad
La información y las publicaciones no constituyen, ni deben considerarse como, asesoramiento o recomendaciones financieras, de inversión, de trading u otro tipo, proporcionadas o respaldadas por TradingView. Obtenga más información en Condiciones de uso.
Exención de responsabilidad
La información y las publicaciones no constituyen, ni deben considerarse como, asesoramiento o recomendaciones financieras, de inversión, de trading u otro tipo, proporcionadas o respaldadas por TradingView. Obtenga más información en Condiciones de uso.