VIX/VXN Expected Move +1 /-1 STD from 6pm open
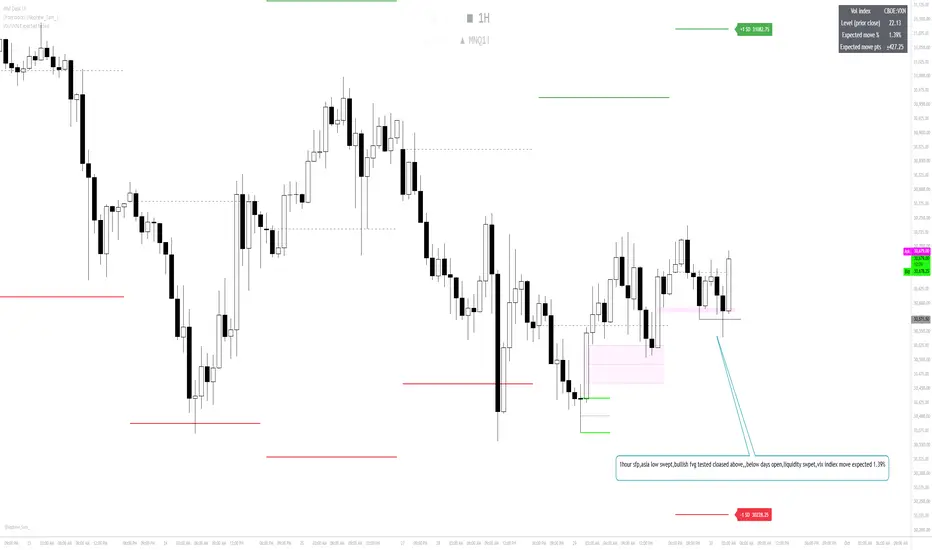
VIX/VXN Expected Move
Plots the one-standard-deviation expected daily range for futures, using the implied volatility of the options market. The indicator automatically uses VXN for Nasdaq (NQ) and the VIX for the S&P 500 (ES), YM and other symbols. You can also select either index manually.
How it works
Expected move (%) = VIX ÷ √252. That percentage is applied to the day's open (or the prior close, your choice) to draw an upper and lower band. The volatility reading comes from the prior day's close, so the levels stay fixed for the whole session.
Features
Upper and lower expected-move lines with price labels
Anchor line at the daily open or prior close
Adjustable SD multiplier (for example, 2 SD for the wider band)
Info table showing the volatility index used, its level, and the expected move in % and ticks
Built-in hit-rate tracker showing how often price stayed inside the band, closed inside it, or touched the upper and lower lines
How to use it
Use it on an intraday chart of ES1!, NQ1! or YM1! as a guide to how far price may travel in a session. Price is statistically expected to stay inside a 1 SD band about 68% of the time, so it is useful for setting realistic targets, judging when a move is stretched, and spotting breakouts beyond the band. It shows a range, not a direction.
Plots the one-standard-deviation expected daily range for futures, using the implied volatility of the options market. The indicator automatically uses VXN for Nasdaq (NQ) and the VIX for the S&P 500 (ES), YM and other symbols. You can also select either index manually.
How it works
Expected move (%) = VIX ÷ √252. That percentage is applied to the day's open (or the prior close, your choice) to draw an upper and lower band. The volatility reading comes from the prior day's close, so the levels stay fixed for the whole session.
Features
Upper and lower expected-move lines with price labels
Anchor line at the daily open or prior close
Adjustable SD multiplier (for example, 2 SD for the wider band)
Info table showing the volatility index used, its level, and the expected move in % and ticks
Built-in hit-rate tracker showing how often price stayed inside the band, closed inside it, or touched the upper and lower lines
How to use it
Use it on an intraday chart of ES1!, NQ1! or YM1! as a guide to how far price may travel in a session. Price is statistically expected to stay inside a 1 SD band about 68% of the time, so it is useful for setting realistic targets, judging when a move is stretched, and spotting breakouts beyond the band. It shows a range, not a direction.

Exención de responsabilidad
La información y las publicaciones no constituyen, ni deben considerarse como, asesoramiento o recomendaciones financieras, de inversión, de trading u otro tipo, proporcionadas o respaldadas por TradingView. Obtenga más información en Condiciones de uso.
Exención de responsabilidad
La información y las publicaciones no constituyen, ni deben considerarse como, asesoramiento o recomendaciones financieras, de inversión, de trading u otro tipo, proporcionadas o respaldadas por TradingView. Obtenga más información en Condiciones de uso.