DISTANCE % PH-PL MTF Dashboard
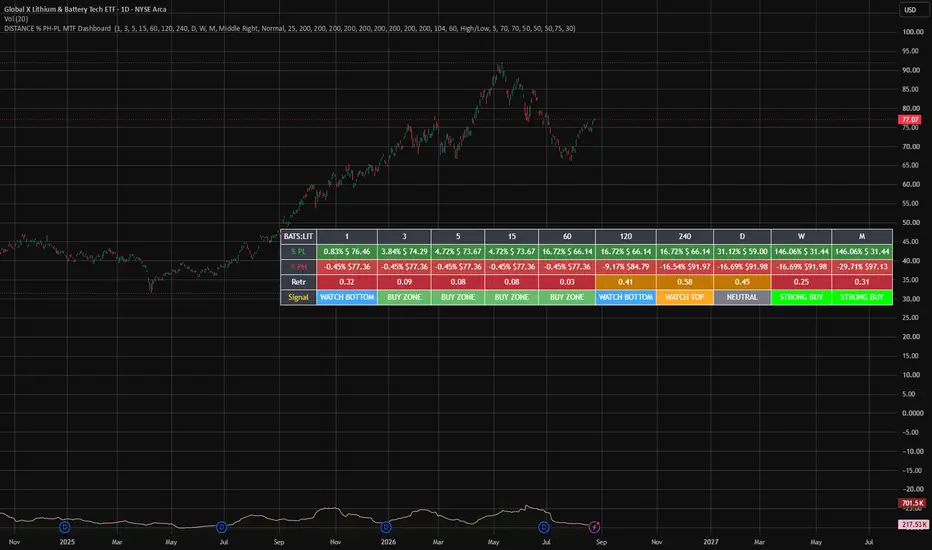
This is a very comprehensive Pine Script indicator for TradingView that creates a multi-timeframe (MTF) dashboard showing price distance from period highs (PH) and lows (PL), along with retracement levels and trade suggestions.
Here's a detailed breakdown of what this indicator does and how to use it:
Core Functionality
1. Multi-Timeframe Dashboard
Displays data for up to 10 customizable timeframes (1min, 3min, 5min, 15min, 60min, 120min, 240min, Daily, Weekly, Monthly)
Shows the percentage distance from Period High and Period Low for each timeframe
Visual color coding (green for bullish, red for bearish, gray for neutral)
Customizable location (8 positions), size, colors, and transparency
2. Key Metrics Displayed
% PL (Distance from Period Low): How far current price is above the period low
% PH (Distance from Period High): How far current price is below the period high
Retracement Ratio: Position within the PH-PL range (0 = at PL, 1 = at PH)
Trade Suggestions: Generated based on PL%, PH%, and retracement values
3. Dynamic Length Settings
Each timeframe can have its own lookback period (length)
Toggle between dynamic (per timeframe) or common length
Default lengths: 200 bars for most timeframes, 104 for Weekly, 60 for Monthly
4. Alert System
PL% Extreme alerts (near period lows - oversold)
PH% Extreme alerts (near period highs - overbought)
New Period High/Low alerts
Retracement level alerts (customizable levels)
MTF Confluence alerts (when 3+ timeframes show same extreme)
Breakout alerts (price moves away from extreme levels)
Visual Elements
Dashboard Table
text
| Symbol | 1 | 3 | 5 | 15 | 60 | 120 | 240 | D | W | M |
| % PL | 2.5%| 1.8%| 3.2%| 0.5%| 4.1%| 6.2%| 8.1%| 2.3%| 5.7%| 9.4%|
| % PH | 5.2%| 6.8%| 4.3%| 7.1%| 3.9%| 2.5%| 1.8%| 6.5%| 4.2%| 1.9%|
| Retr | 0.32| 0.21| 0.43| 0.07| 0.51| 0.71| 0.82| 0.26| 0.58| 0.83|
| Signal | BUY | BUY | WATCH|BUY | NEUT|SELL |SELL |BUY | SELL |SELL |
Chart Plots
Distance from PH (red line)
Distance from PL (green line)
Retracement (white line, displayed as 0-100%)
Horizontal reference lines at 25%, 50%, 75%, 0%
Trade Suggestion Logic
Condition Signal
PL > 70% AND Ret < 0.33 STRONG BUY
PL > 70% BUY
Ret < 0.25 BUY ZONE
PH > 70% AND Ret > 0.66 STRONG SELL
PH > 70% SELL
Ret > 0.75 SELL ZONE
Ret 0.45-0.55 NEUTRAL
Ret > 0.55 WATCH TOP
Ret < 0.45 WATCH BOTTOM
Key Input Settings
Timeframes
Customize each of the 10 timeframes using standard TradingView format (1, 3, 5, 15, 60, 120, 240, D, W, M)
Length Settings
Toggle dynamic length per timeframe
Set individual lengths for each timeframe
Default common length: 200 bars
Dashboard Display
Location: 8 positions
Size: Tiny, Small, Normal, Large
Customizable colors for bullish/bearish/neutral cells
Show/hide PH and PL prices
Show/hide retracement and trade suggestions
Alert Settings
Adjustable thresholds for PL% and PH% alerts (default: 50%)
Toggle specific alert types on/off
Customizable retracement levels (comma-separated)
MTF confluence threshold (default: 30%)
Usage Tips
For Swing Trading: Focus on higher timeframes (D, W, M) for trend identification
For Day Trading: Use lower timeframes (1-15min) for entry/exit signals
For Overbought/Oversold: Watch PL% > 70% (oversold) and PH% > 70% (overbought)
For Trend Reversals: Look for retracement moving from extremes (>0.66 or <0.33) back towards 0.5
FOR EDUCATIONAL PURPOSES ONLY\BOT A FINANCIAL ADVICE
Here's a detailed breakdown of what this indicator does and how to use it:
Core Functionality
1. Multi-Timeframe Dashboard
Displays data for up to 10 customizable timeframes (1min, 3min, 5min, 15min, 60min, 120min, 240min, Daily, Weekly, Monthly)
Shows the percentage distance from Period High and Period Low for each timeframe
Visual color coding (green for bullish, red for bearish, gray for neutral)
Customizable location (8 positions), size, colors, and transparency
2. Key Metrics Displayed
% PL (Distance from Period Low): How far current price is above the period low
% PH (Distance from Period High): How far current price is below the period high
Retracement Ratio: Position within the PH-PL range (0 = at PL, 1 = at PH)
Trade Suggestions: Generated based on PL%, PH%, and retracement values
3. Dynamic Length Settings
Each timeframe can have its own lookback period (length)
Toggle between dynamic (per timeframe) or common length
Default lengths: 200 bars for most timeframes, 104 for Weekly, 60 for Monthly
4. Alert System
PL% Extreme alerts (near period lows - oversold)
PH% Extreme alerts (near period highs - overbought)
New Period High/Low alerts
Retracement level alerts (customizable levels)
MTF Confluence alerts (when 3+ timeframes show same extreme)
Breakout alerts (price moves away from extreme levels)
Visual Elements
Dashboard Table
text
| Symbol | 1 | 3 | 5 | 15 | 60 | 120 | 240 | D | W | M |
| % PL | 2.5%| 1.8%| 3.2%| 0.5%| 4.1%| 6.2%| 8.1%| 2.3%| 5.7%| 9.4%|
| % PH | 5.2%| 6.8%| 4.3%| 7.1%| 3.9%| 2.5%| 1.8%| 6.5%| 4.2%| 1.9%|
| Retr | 0.32| 0.21| 0.43| 0.07| 0.51| 0.71| 0.82| 0.26| 0.58| 0.83|
| Signal | BUY | BUY | WATCH|BUY | NEUT|SELL |SELL |BUY | SELL |SELL |
Chart Plots
Distance from PH (red line)
Distance from PL (green line)
Retracement (white line, displayed as 0-100%)
Horizontal reference lines at 25%, 50%, 75%, 0%
Trade Suggestion Logic
Condition Signal
PL > 70% AND Ret < 0.33 STRONG BUY
PL > 70% BUY
Ret < 0.25 BUY ZONE
PH > 70% AND Ret > 0.66 STRONG SELL
PH > 70% SELL
Ret > 0.75 SELL ZONE
Ret 0.45-0.55 NEUTRAL
Ret > 0.55 WATCH TOP
Ret < 0.45 WATCH BOTTOM
Key Input Settings
Timeframes
Customize each of the 10 timeframes using standard TradingView format (1, 3, 5, 15, 60, 120, 240, D, W, M)
Length Settings
Toggle dynamic length per timeframe
Set individual lengths for each timeframe
Default common length: 200 bars
Dashboard Display
Location: 8 positions
Size: Tiny, Small, Normal, Large
Customizable colors for bullish/bearish/neutral cells
Show/hide PH and PL prices
Show/hide retracement and trade suggestions
Alert Settings
Adjustable thresholds for PL% and PH% alerts (default: 50%)
Toggle specific alert types on/off
Customizable retracement levels (comma-separated)
MTF confluence threshold (default: 30%)
Usage Tips
For Swing Trading: Focus on higher timeframes (D, W, M) for trend identification
For Day Trading: Use lower timeframes (1-15min) for entry/exit signals
For Overbought/Oversold: Watch PL% > 70% (oversold) and PH% > 70% (overbought)
For Trend Reversals: Look for retracement moving from extremes (>0.66 or <0.33) back towards 0.5
FOR EDUCATIONAL PURPOSES ONLY\BOT A FINANCIAL ADVICE

Exención de responsabilidad
La información y las publicaciones no constituyen, ni deben considerarse como, asesoramiento o recomendaciones financieras, de inversión, de trading u otro tipo, proporcionadas o respaldadas por TradingView. Obtenga más información en Condiciones de uso.
Exención de responsabilidad
La información y las publicaciones no constituyen, ni deben considerarse como, asesoramiento o recomendaciones financieras, de inversión, de trading u otro tipo, proporcionadas o respaldadas por TradingView. Obtenga más información en Condiciones de uso.