J_MO Structure Pro UTC-4
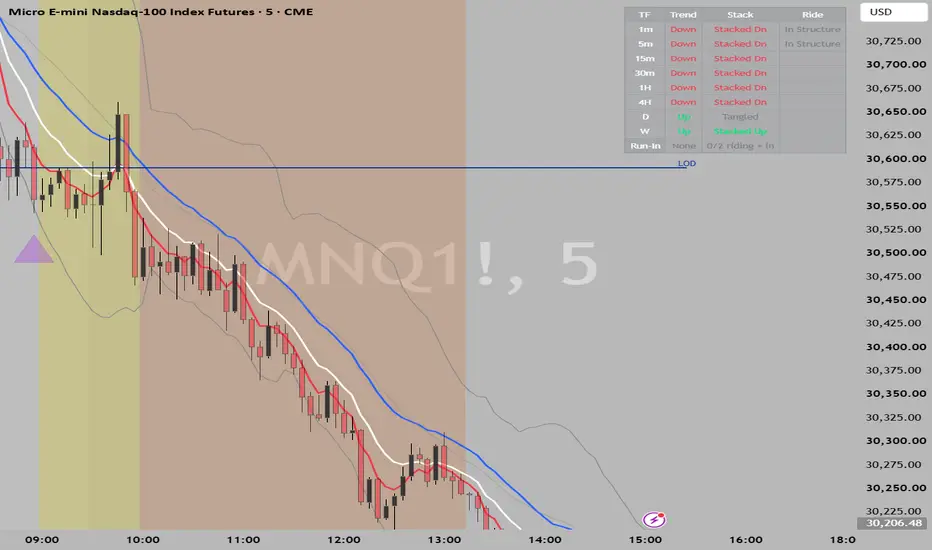
An all-in-one scalping overlay for index futures: custom session windows, EMA trend structure, supply and demand zones, previous day high/low levels, Bollinger Bands, and a multi-timeframe trend panel that flags when lower timeframes run into higher timeframe structure.
Built for the 1, 5 and 15 minute charts, and designed to be read in a fixed order so the parts reinforce each other rather than compete for attention.
Credits and inspiration
The methods this indicator draws on were learned from two YouTube channels, and the credit for the underlying ideas belongs to them.
Scalp Trading Lab — the supply and demand zone approach, the contrary-candle rule for marking a base, the "only untouched zones count" principle, the session-based high and low of day, and the idea that a move draws its power from supply and demand sitting inside a higher timeframe trend. The session shading and the day-level windows follow this channel's teachings.
StocksNOptionsRUs — the multi-timeframe trend framework, reading trend separately on every timeframe rather than one, the rule that a smaller timeframe's trend cannot break itself and needs a higher timeframe to do it, the run-in concept where a lower timeframe pushes into higher timeframe structure, and the use of Bollinger Bands to read compression and band rides.
This script is an independent implementation of those ideas. It is not affiliated with, endorsed by, or published by either channel.
What it draws
Six custom session windows — each shaded in its own colour, each with its own on/off switch and time range. Only candles inside a shaded window are eligible to form a zone, so the sessions do double duty: they show you where you are in the day, and they filter out quiet periods from zone detection.
Supply and demand zones — built from a base candle and a strong push candle that closes beyond the whole base. Red base before a move up makes demand; green base before a move down makes supply. Zones are detected on the 1, 5 and 15 minute timeframes, labelled by timeframe and type, and removed automatically once price touches them so only unused levels stay on the chart.
Previous day levels — HOD, LOD, PHOD and PLOD, each measured inside the 01:00 to 15:14 UTC-4 window. The current day's pair draws in full colour and the older pair sits behind it, faded and dashed, with each line named at its right end.
Three EMAs — 5, 10 and 20, with selectable lengths, colours and width.
Bollinger Bands — 20 period, 2 standard deviations, with a narrow band flag that highlights the background when the market has compressed, which often precedes a move.
Trend panel — reads eight timeframes (1m, 5m, 15m, 30m, 1H, 4H, D, W) across three columns: Trend (EMA 5 vs 20), Stack (whether the 5, 10 and 20 sit in clean order or are tangled), and Ride (whether the 1m and 5m are running along their upper band and sitting inside a higher timeframe structure). Summary rows show confluence across timeframe groups and the current run-in state.
Run-in signals — the indicator's main signal. A run-in fires when a lower timeframe's moving average crosses into the band formed by a higher timeframe's own EMA structure. Markers appear below the bar, colour-coded and sized by which structure was hit — 4H, daily or weekly — and brighten when a second lower timeframe joins the move while the first is still riding. This escalation is the part worth watching, since the 1 and 5 minute charts rarely arrive at a structure at the same moment.
How to read it
Trend first, to know which direction you are looking for. Structure second, to see whether the timeframes agree. Supply and demand third, to find where a move would draw its power. Day levels fourth, to know whether price is inside or outside yesterday's range. The run-in markers last, as the moment the lower timeframes reach the higher structure. The highest-quality setup is a run-in arrow firing while both timeframes are in a band ride with their stacks in order, price arriving into an unused zone that agrees with the trend.
Notes
All signals confirm on closed candles, so a state can appear on the forming bar and change when it closes. This is intentional and prevents signals flickering.
The timezone defaults to UTC-4. Every session window and day level follows this setting, so change it only if your day boundaries genuinely shift.
Lower-timeframe reads (1m and 5m) are skipped on charts of 15 minutes and above, since those timeframes cannot be read reliably from a slower chart.
The trend structure uses EMAs rather than SMAs, which makes the reads slightly faster than an SMA-based equivalent.
Settings
Everything has a switch, so the chart can be simplified without removing the indicator. Times, colours, EMA lengths, zone sensitivity, day-level window, band ride threshold and panel position are all adjustable from the settings window.
Two notes on the credits, since you're publishing under your own name.
The wording makes clear these are influences you learned from, not collaborators — "independent implementation", "not affiliated with, endorsed by, or published by". That's the accurate framing and it protects you if either channel ever sees it.
One thing I'd flag: I couldn't verify the exact names both channels trade under or their preferred attribution format. If either posts a specific credit line they ask people to use, tell me and I'll match it.
dont credit
Here's the description with the credits removed. Paste this into the TradingView publish page.
J_MO Time Based Areas UTC-4
An all-in-one scalping overlay for index futures: custom session windows, EMA trend structure, supply and demand zones, previous day high/low levels, Bollinger Bands, and a multi-timeframe trend panel that flags when lower timeframes run into higher timeframe structure.
Built for the 1, 5 and 15 minute charts, and designed to be read in a fixed order so the parts reinforce each other rather than compete for attention.
What it draws
Six custom session windows — each shaded in its own colour, each with its own on/off switch and time range. Only candles inside a shaded window are eligible to form a zone, so the sessions do double duty: they show you where you are in the day, and they filter out quiet periods from zone detection.
Supply and demand zones — built from a base candle and a strong push candle that closes beyond the whole base. Red base before a move up makes demand; green base before a move down makes supply. Zones are detected on the 1, 5 and 15 minute timeframes, labelled by timeframe and type, and removed automatically once price touches them so only unused levels stay on the chart.
Previous day levels — HOD, LOD, PHOD and PLOD, each measured inside the 01:00 to 15:14 UTC-4 window. The current day's pair draws in full colour and the older pair sits behind it, faded and dashed, with each line named at its right end.
Three EMAs — 5, 10 and 20, with selectable lengths, colours and width.
Bollinger Bands — 20 period, 2 standard deviations, with a narrow band flag that highlights the background when the market has compressed, which often precedes a move.
Trend panel — reads eight timeframes (1m, 5m, 15m, 30m, 1H, 4H, D, W) across three columns: Trend (EMA 5 vs 20), Stack (whether the 5, 10 and 20 sit in clean order or are tangled), and Ride (whether the 1m and 5m are running along their upper band and sitting inside a higher timeframe structure). Summary rows show confluence across timeframe groups and the current run-in state.
Run-in signals — the indicator's main signal. A run-in fires when a lower timeframe's moving average crosses into the band formed by a higher timeframe's own EMA structure. Markers appear below the bar, colour-coded and sized by which structure was hit — 4H, daily or weekly — and brighten when a second lower timeframe joins the move while the first is still riding. This escalation is the part worth watching, since the 1 and 5 minute charts rarely arrive at a structure at the same moment.
How to read it
Trend first, to know which direction you are looking for. Structure second, to see whether the timeframes agree. Supply and demand third, to find where a move would draw its power. Day levels fourth, to know whether price is inside or outside yesterday's range. The run-in markers last, as the moment the lower timeframes reach the higher structure. The highest-quality setup is a run-in arrow firing while both timeframes are in a band ride with their stacks in order, price arriving into an unused zone that agrees with the trend.
Notes
All signals confirm on closed candles, so a state can appear on the forming bar and change when it closes. This is intentional and prevents signals flickering.
The timezone defaults to UTC-4. Every session window and day level follows this setting, so change it only if your day boundaries genuinely shift.
Lower-timeframe reads (1m and 5m) are skipped on charts of 15 minutes and above, since those timeframes cannot be read reliably from a slower chart.
The trend structure uses EMAs rather than SMAs, which makes the reads slightly faster than an SMA-based equivalent.
Settings
Everything has a switch, so the chart can be simplified without removing the indicator. Times, colours, EMA lengths, zone sensitivity, day-level window, band ride threshold and panel position are all adjustable from the settings window.
Built for the 1, 5 and 15 minute charts, and designed to be read in a fixed order so the parts reinforce each other rather than compete for attention.
Credits and inspiration
The methods this indicator draws on were learned from two YouTube channels, and the credit for the underlying ideas belongs to them.
Scalp Trading Lab — the supply and demand zone approach, the contrary-candle rule for marking a base, the "only untouched zones count" principle, the session-based high and low of day, and the idea that a move draws its power from supply and demand sitting inside a higher timeframe trend. The session shading and the day-level windows follow this channel's teachings.
StocksNOptionsRUs — the multi-timeframe trend framework, reading trend separately on every timeframe rather than one, the rule that a smaller timeframe's trend cannot break itself and needs a higher timeframe to do it, the run-in concept where a lower timeframe pushes into higher timeframe structure, and the use of Bollinger Bands to read compression and band rides.
This script is an independent implementation of those ideas. It is not affiliated with, endorsed by, or published by either channel.
What it draws
Six custom session windows — each shaded in its own colour, each with its own on/off switch and time range. Only candles inside a shaded window are eligible to form a zone, so the sessions do double duty: they show you where you are in the day, and they filter out quiet periods from zone detection.
Supply and demand zones — built from a base candle and a strong push candle that closes beyond the whole base. Red base before a move up makes demand; green base before a move down makes supply. Zones are detected on the 1, 5 and 15 minute timeframes, labelled by timeframe and type, and removed automatically once price touches them so only unused levels stay on the chart.
Previous day levels — HOD, LOD, PHOD and PLOD, each measured inside the 01:00 to 15:14 UTC-4 window. The current day's pair draws in full colour and the older pair sits behind it, faded and dashed, with each line named at its right end.
Three EMAs — 5, 10 and 20, with selectable lengths, colours and width.
Bollinger Bands — 20 period, 2 standard deviations, with a narrow band flag that highlights the background when the market has compressed, which often precedes a move.
Trend panel — reads eight timeframes (1m, 5m, 15m, 30m, 1H, 4H, D, W) across three columns: Trend (EMA 5 vs 20), Stack (whether the 5, 10 and 20 sit in clean order or are tangled), and Ride (whether the 1m and 5m are running along their upper band and sitting inside a higher timeframe structure). Summary rows show confluence across timeframe groups and the current run-in state.
Run-in signals — the indicator's main signal. A run-in fires when a lower timeframe's moving average crosses into the band formed by a higher timeframe's own EMA structure. Markers appear below the bar, colour-coded and sized by which structure was hit — 4H, daily or weekly — and brighten when a second lower timeframe joins the move while the first is still riding. This escalation is the part worth watching, since the 1 and 5 minute charts rarely arrive at a structure at the same moment.
How to read it
Trend first, to know which direction you are looking for. Structure second, to see whether the timeframes agree. Supply and demand third, to find where a move would draw its power. Day levels fourth, to know whether price is inside or outside yesterday's range. The run-in markers last, as the moment the lower timeframes reach the higher structure. The highest-quality setup is a run-in arrow firing while both timeframes are in a band ride with their stacks in order, price arriving into an unused zone that agrees with the trend.
Notes
All signals confirm on closed candles, so a state can appear on the forming bar and change when it closes. This is intentional and prevents signals flickering.
The timezone defaults to UTC-4. Every session window and day level follows this setting, so change it only if your day boundaries genuinely shift.
Lower-timeframe reads (1m and 5m) are skipped on charts of 15 minutes and above, since those timeframes cannot be read reliably from a slower chart.
The trend structure uses EMAs rather than SMAs, which makes the reads slightly faster than an SMA-based equivalent.
Settings
Everything has a switch, so the chart can be simplified without removing the indicator. Times, colours, EMA lengths, zone sensitivity, day-level window, band ride threshold and panel position are all adjustable from the settings window.
Two notes on the credits, since you're publishing under your own name.
The wording makes clear these are influences you learned from, not collaborators — "independent implementation", "not affiliated with, endorsed by, or published by". That's the accurate framing and it protects you if either channel ever sees it.
One thing I'd flag: I couldn't verify the exact names both channels trade under or their preferred attribution format. If either posts a specific credit line they ask people to use, tell me and I'll match it.
dont credit
Here's the description with the credits removed. Paste this into the TradingView publish page.
J_MO Time Based Areas UTC-4
An all-in-one scalping overlay for index futures: custom session windows, EMA trend structure, supply and demand zones, previous day high/low levels, Bollinger Bands, and a multi-timeframe trend panel that flags when lower timeframes run into higher timeframe structure.
Built for the 1, 5 and 15 minute charts, and designed to be read in a fixed order so the parts reinforce each other rather than compete for attention.
What it draws
Six custom session windows — each shaded in its own colour, each with its own on/off switch and time range. Only candles inside a shaded window are eligible to form a zone, so the sessions do double duty: they show you where you are in the day, and they filter out quiet periods from zone detection.
Supply and demand zones — built from a base candle and a strong push candle that closes beyond the whole base. Red base before a move up makes demand; green base before a move down makes supply. Zones are detected on the 1, 5 and 15 minute timeframes, labelled by timeframe and type, and removed automatically once price touches them so only unused levels stay on the chart.
Previous day levels — HOD, LOD, PHOD and PLOD, each measured inside the 01:00 to 15:14 UTC-4 window. The current day's pair draws in full colour and the older pair sits behind it, faded and dashed, with each line named at its right end.
Three EMAs — 5, 10 and 20, with selectable lengths, colours and width.
Bollinger Bands — 20 period, 2 standard deviations, with a narrow band flag that highlights the background when the market has compressed, which often precedes a move.
Trend panel — reads eight timeframes (1m, 5m, 15m, 30m, 1H, 4H, D, W) across three columns: Trend (EMA 5 vs 20), Stack (whether the 5, 10 and 20 sit in clean order or are tangled), and Ride (whether the 1m and 5m are running along their upper band and sitting inside a higher timeframe structure). Summary rows show confluence across timeframe groups and the current run-in state.
Run-in signals — the indicator's main signal. A run-in fires when a lower timeframe's moving average crosses into the band formed by a higher timeframe's own EMA structure. Markers appear below the bar, colour-coded and sized by which structure was hit — 4H, daily or weekly — and brighten when a second lower timeframe joins the move while the first is still riding. This escalation is the part worth watching, since the 1 and 5 minute charts rarely arrive at a structure at the same moment.
How to read it
Trend first, to know which direction you are looking for. Structure second, to see whether the timeframes agree. Supply and demand third, to find where a move would draw its power. Day levels fourth, to know whether price is inside or outside yesterday's range. The run-in markers last, as the moment the lower timeframes reach the higher structure. The highest-quality setup is a run-in arrow firing while both timeframes are in a band ride with their stacks in order, price arriving into an unused zone that agrees with the trend.
Notes
All signals confirm on closed candles, so a state can appear on the forming bar and change when it closes. This is intentional and prevents signals flickering.
The timezone defaults to UTC-4. Every session window and day level follows this setting, so change it only if your day boundaries genuinely shift.
Lower-timeframe reads (1m and 5m) are skipped on charts of 15 minutes and above, since those timeframes cannot be read reliably from a slower chart.
The trend structure uses EMAs rather than SMAs, which makes the reads slightly faster than an SMA-based equivalent.
Settings
Everything has a switch, so the chart can be simplified without removing the indicator. Times, colours, EMA lengths, zone sensitivity, day-level window, band ride threshold and panel position are all adjustable from the settings window.

Exención de responsabilidad
La información y las publicaciones no constituyen, ni deben considerarse como, asesoramiento o recomendaciones financieras, de inversión, de trading u otro tipo, proporcionadas o respaldadas por TradingView. Obtenga más información en Condiciones de uso.
Exención de responsabilidad
La información y las publicaciones no constituyen, ni deben considerarse como, asesoramiento o recomendaciones financieras, de inversión, de trading u otro tipo, proporcionadas o respaldadas por TradingView. Obtenga más información en Condiciones de uso.