Actualizado
ICT - Fair Value Gaps (multi timeframe)
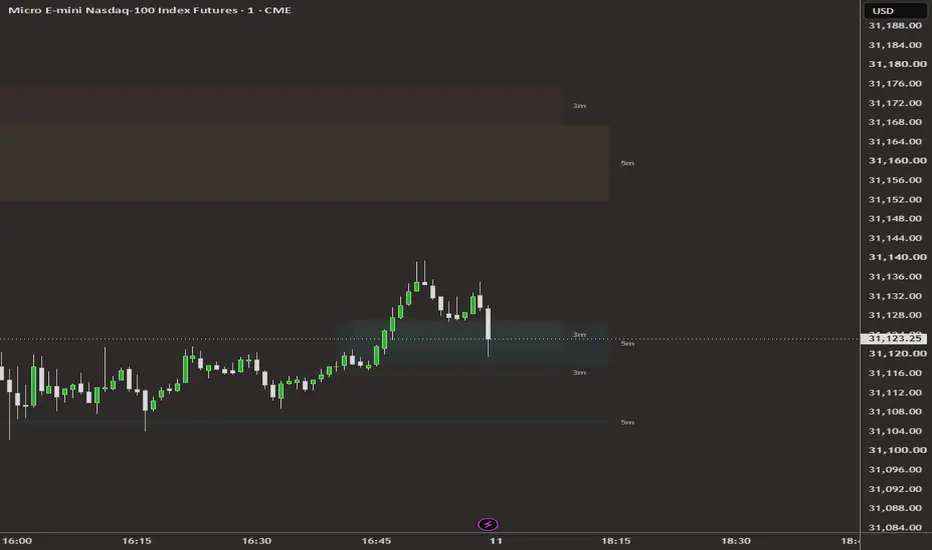
MTF FVG + Volume Imbalance
Overview
This indicator automatically identifies and draws Fair Value Gaps (FVGs) and Volume Imbalances (VIs) across 9 timeframes (1m, 3m, 5m, 15m, 1h, 3h, 4h, 1d, 1w) directly on your TradingView chart, eliminating the need to manually switch timeframes.
Fair Value Gap (FVG)
A 3-candle imbalance where a gap exists between the wick of candle 1 and the wick of candle 3. These zones often act as areas where price may return before continuing in its original direction.
Bullish FVG — low of candle 3 is above high of candle 1
Bearish FVG — high of candle 3 is below low of candle 1
Volume Imbalance (VI)
When a body gap exists between adjacent candles within the FVG pattern, the indicator automatically extends the FVG box to include the imbalance zone, giving a more complete picture of the area of interest.
Mitigation
A box is automatically removed when price closes beyond the gap boundary — keeping your chart clean with only active unmitigated zones visible.
Key Settings
Per Timeframe:
Show/hide toggle
Project to lower timeframes — disabled by default. When enabled, FVGs from that timeframe are visible on all lower timeframe charts. FVGs can never project upward.
Bullish/bearish colour pickers — assign unique colours per timeframe to distinguish zones when multiple timeframes are projected onto the same chart
Lookback Periods — FVGs are restricted to a configurable lookback window to keep the chart focused on recent price action:
GroupTimeframesDefaultIntraday1m, 3m, 5m, 15m5 daysHourly1h, 3h, 4h14 daysDaily1d30 daysWeekly1w140 days
Box Extension — boxes extend to the chart edge by default, updating in real time. Alternatively set a fixed N bar extension in the settings.
For analytical purposes only. Always combine with your own analysis and risk management.
Overview
This indicator automatically identifies and draws Fair Value Gaps (FVGs) and Volume Imbalances (VIs) across 9 timeframes (1m, 3m, 5m, 15m, 1h, 3h, 4h, 1d, 1w) directly on your TradingView chart, eliminating the need to manually switch timeframes.
Fair Value Gap (FVG)
A 3-candle imbalance where a gap exists between the wick of candle 1 and the wick of candle 3. These zones often act as areas where price may return before continuing in its original direction.
Bullish FVG — low of candle 3 is above high of candle 1
Bearish FVG — high of candle 3 is below low of candle 1
Volume Imbalance (VI)
When a body gap exists between adjacent candles within the FVG pattern, the indicator automatically extends the FVG box to include the imbalance zone, giving a more complete picture of the area of interest.
Mitigation
A box is automatically removed when price closes beyond the gap boundary — keeping your chart clean with only active unmitigated zones visible.
Key Settings
Per Timeframe:
Show/hide toggle
Project to lower timeframes — disabled by default. When enabled, FVGs from that timeframe are visible on all lower timeframe charts. FVGs can never project upward.
Bullish/bearish colour pickers — assign unique colours per timeframe to distinguish zones when multiple timeframes are projected onto the same chart
Lookback Periods — FVGs are restricted to a configurable lookback window to keep the chart focused on recent price action:
GroupTimeframesDefaultIntraday1m, 3m, 5m, 15m5 daysHourly1h, 3h, 4h14 daysDaily1d30 daysWeekly1w140 days
Box Extension — boxes extend to the chart edge by default, updating in real time. Alternatively set a fixed N bar extension in the settings.
For analytical purposes only. Always combine with your own analysis and risk management.
Notas de prensa
Script updated to exclude NWOGs and NDOGs from FVG logic. This should tidy up the chart.Notas de prensa
1. NDOG & NWOG Session Gap FilterFVGs spanning daily (5pm–6pm ET) and weekly (Fri 5pm–Sun 6pm ET) session gaps are now ignored
Dual filter: session window check on all three candle timestamps + time gap check (4× expected TF duration)
2. New Timeframes
Added 7h, 3D, 1M, 3M, 12M — total now 14 timeframes
New lookback groups: Multi-Day (90d), Monthly (730d), Quarterly (1095d), Annual (1825d)
3. Optimised Settings Menu
Consolidated from 14 individual groups into 7 logical groups
inline= used to place bull/bear colour pickers on the same row, significantly reducing scrolling
4. Show Mitigated FVGs
New toggle (default OFF) at top of settings panel
When ON, mitigated boxes remain visible as outline only (no fill, border width 2)
Active boxes retain original styling (fill + border width 1)
Mitigated boxes respect lookback period
Notas de prensa
1. Candle-Based Lookback (replaces time-based)Replaced timenow - days * 86400000 with bar_index-based cutoffs per timeframe
Each timeframe fetches its own current bar_index via request.security() — cutoff = total_bars - lookback_candles
Works identically across all instruments regardless of session schedule, calendar variability, or timezone
Fixes FVGs not displaying on DXY, BTC and other instruments on 3D, 1W, 1M and 12M timeframes
2. Time Gap Check Removed
The (t3 - t1) > expected_ms * 4 check has been removed entirely
Was incorrectly filtering valid FVGs on higher timeframes due to variable month/year lengths
Candle-based lookback now handles scope naturally — the time gap check is no longer needed
3. Session Gap Filter Simplified
is_session_gap() now takes no tf_mins parameter
Window check only applied to intraday timeframes (rank <= 8, up to 7h)
Daily and above are never filtered — they have no intraday session gaps
4. Lookback Defaults Updated
Now expressed in candles rather than days:
GroupDefaultIntraday (1m–15m)500 candlesHourly (1h–7h)500 candlesDaily (1d)365 candlesMulti-Day (3D)200 candlesWeekly (1w)260 candlesMonthly (1M)60 candlesQuarterly (3M)40 candlesAnnual (12M)20 candles
Notas de prensa
Improved detection logic to filter out NWOG and NDOGNotas de prensa
Various updates to add flexibility and improve visuals. Happy to receive any feedback/improvement requests.Notas de prensa
v1.8New
• 2h timeframe: its settings sit at the bottom of the list, so your saved settings stay as they are.
• "Hide session-gap FVGs" setting (on by default): an FVG that spans a market close is hidden when price reopened beyond the previous candle's high (bullish) or low (bearish). This covers daily and weekend reopens and holiday closures on any symbol. Daily and higher FVGs are never filtered.
Fixes and improvements
• Lower-timeframe FVGs no longer project up onto long monthly, weekly or daily charts such as 2M or 6M.
• Projection labels no longer pile up near a market close or over the weekend.
• Charts no longer load data for timeframes below their own, which can't be displayed on them.
Tip: on stocks with regular hours only, the overnight gap forms many higher-timeframe FVGs. Switch off "Hide session-gap FVGs" to see them.
Notas de prensa
v1.10New
• Proximity Filter (off by default): "Display X live FVGs on either side of price" shows only the X nearest FVGs above the current price and the X nearest below, for each enabled or projected timeframe. Set X to 1 to see just the single nearest FVG per side per timeframe. An FVG sitting on the current price is always shown.
• Hidden FVGs are not deleted — they reappear as price moves toward them, and mitigation tracking is unaffected. The "Max FVGs Displayed" caps work as before underneath the filter.
Your saved settings stay as they are: the new controls sit at the bottom of the settings list.
Notas de prensa
v1.11: settings reorganised, new anti-clutter defaultsIMPORTANT: please remove the indicator from your chart and add it again
The settings list has been reordered. Settings saved under an earlier version can land on the wrong option after this update. Removing the indicator and adding it again loads the new defaults. (Alternatively: open the settings, click Defaults at the bottom left, then Reset settings.)
What's new
• Settings in a clearer order: Proximity Filter first, then the timeframe rows (2h now sits between 90m and 3h), Session Gaps, Mitigated FVGs, Max FVGs Displayed, Right Edge Offset, Timeframe Label, 50% Line, Box Borders and Colours.
• New defaults, built to keep the chart clean:
· Proximity Filter on: only the nearest FVG above and the nearest below price, for each timeframe
· 3m and 5m FVGs projected onto the 1m chart (an example; tick Project on any row to add the higher timeframes you want)
· Projection spacing 8 bars, so each timeframe's label sits clear of the next
· 50% line off
• Tooltips on Show / Project, Mitigated FVGs, Max FVGs Displayed and Right Edge Offset.
Removed
• The Lookback (Candles) settings. They did not limit anything: how many FVGs are kept is set by Max FVGs Displayed, together with mitigation. What the indicator draws is unchanged.
The indicator today (the April description above is out of date)
• 18 timeframes: 1m, 3m, 5m, 15m, 30m, 1h, 90m, 2h, 3h, 4h, 7h, 12h, 1D, 3D, 1W, 1M, 3M, 12M.
• FVG: the 3-candle gap between candle 1's wick and candle 3's wick, detected on closed candles only.
• Volume imbalance: a body gap inside the pattern widens the zone to the body edge. A body gap between candles 1 and 2 also counts as a zone on its own, as long as candle 3 does not trade back into it.
• Projection: Show draws a timeframe's FVGs on its own chart; tick Project to see them on lower-timeframe charts, and use the → box to choose which ones. FVGs never project upward.
• Mitigation: an FVG is removed when a candle of its own timeframe closes beyond its far side (or kept as an outline with Show Mitigated FVGs).
• Session gaps: FVGs made by the daily and weekend reopen (NDOG / NWOG), holidays and halts are hidden by default (1m to 12h).
A guide to every setting, with screenshots of the settings panel, is on our website: see the link in our profile.
Notas de prensa
v1.12Fixed
• With the Proximity Filter on, FVGs hidden by the filter no longer squash the chart. They were invisible but TradingView's auto-scale still fitted the price axis to them, so distant hidden FVGs stretched the scale. Hidden FVGs are now collapsed while hidden and restored as price approaches; which FVGs show, hide or mitigate is unchanged.
• Colour section titles no longer list timeframes (TradingView shows titles in capitals, so 1m read as 1M).
Changed
• Projection spacing now defaults to 6 bars (was 8). A chart that already has the indicator may keep its current value; set it under Right Edge Offset if you want the new spacing.
Your settings stay as they are: nothing in the settings list has moved.

AlgoTrader NQGC strategies:
ICT22 Model: algotradernqgc.com/ict22-model?via=tvsig
Midas Model: algotradernqgc.com/midas-model?via=tvsig
Atlas Indicators and How to guides:
algotradernqgc.com/indicators
ICT22 Model: algotradernqgc.com/ict22-model?via=tvsig
Midas Model: algotradernqgc.com/midas-model?via=tvsig
Atlas Indicators and How to guides:
algotradernqgc.com/indicators
Exención de responsabilidad
La información y las publicaciones no constituyen, ni deben considerarse como, asesoramiento o recomendaciones financieras, de inversión, de trading u otro tipo, proporcionadas o respaldadas por TradingView. Obtenga más información en Condiciones de uso.
AlgoTrader NQGC strategies:
ICT22 Model: algotradernqgc.com/ict22-model?via=tvsig
Midas Model: algotradernqgc.com/midas-model?via=tvsig
Atlas Indicators and How to guides:
algotradernqgc.com/indicators
ICT22 Model: algotradernqgc.com/ict22-model?via=tvsig
Midas Model: algotradernqgc.com/midas-model?via=tvsig
Atlas Indicators and How to guides:
algotradernqgc.com/indicators
Exención de responsabilidad
La información y las publicaciones no constituyen, ni deben considerarse como, asesoramiento o recomendaciones financieras, de inversión, de trading u otro tipo, proporcionadas o respaldadas por TradingView. Obtenga más información en Condiciones de uso.