OPEN-SOURCE SCRIPT
Actualizado Alpha Council - Non-Causality Suite
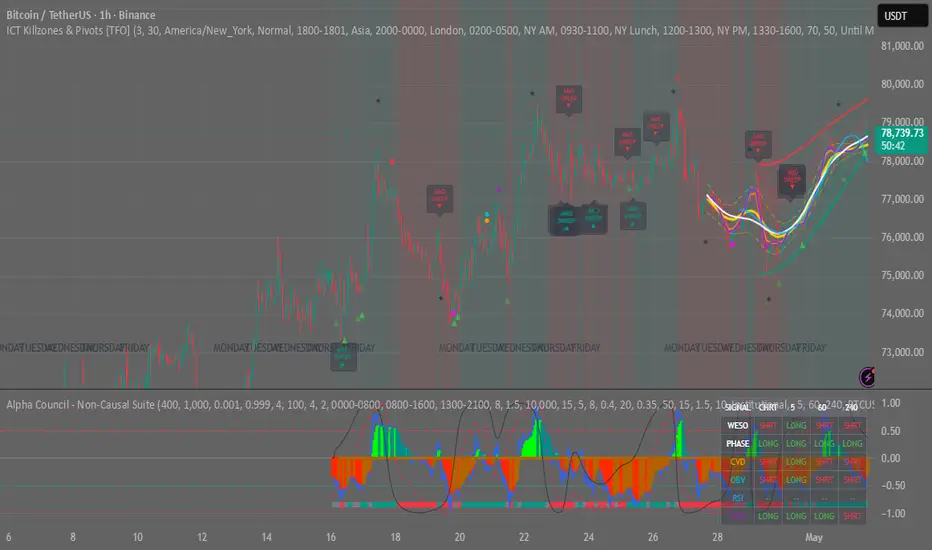
Alpha Council - Non-Causality Suite: PRC & AMD Synthesis
Overview
The Non-Causality Suite is an advanced, multi-dimensional analytical tool designed to identify liquidity sweeps, structural market transitions, and statistical extremes. Traditional indicators often rely on heavily lagging averages, leaving traders vulnerable to sudden market shifts. This suite bypasses traditional chronological lag by integrating a Polynomial Regression Channel (PRC), an Accumulation, Manipulation, Distribution (AMD) microstructure tracker, and a robust Adverse Cascade Vulnerability (ACV) filtering system.
This indicator does not provide automated trading or guaranteed signals; rather, it acts as a "diagnostic dashboard" for the chart's current structural and kinematic state, allowing traders to visualize exactly when a market is overextended and whether that overextension is being absorbed by limit orders.
Core Mechanics: How It Works
This suite is built on three primary mathematical and behavioral pillars:
1. The Spatial Map: Polynomial Regression Channel (PRC)
Instead of using standard moving averages or rigid envelopes that suffer from "curve accommodation" (bending too slowly to extreme wicks), this suite utilizes an Ordinary Least Squares (OLS) Matrix Inversion.
The script continuously calculates a 2nd-degree (or higher) polynomial curve to fit the immediate momentum of the data.
This generates a fast-twitch "net" (the PRC) that dynamically expands based on local volatility. It snaps to liquidation wicks instantly, providing a highly responsive boundary for statistical extremes.
2. Behavioral Structure: AMD Liquidity Tracking
Markets, especially highly leveraged ones, are driven by liquidity hunting. The suite maps this via the AMD (Accumulation, Manipulation, Distribution) cycle:
Accumulation: The script tracks rolling Swing Highs and Swing Lows to identify tight, localized ranges where stop-losses are clustered.
Manipulation (The Sweep): When price violently breaks out of this accumulation box and simultaneously pierces the outer bands of the PRC, it is flagged as a potential manipulation sweep (liquidity grab).
Distribution (The Reclaim): The suite waits for the price to reject the extreme and close back inside the accumulation zone before confirming the structural shift.
3. Defense Vault: Adverse Cascade Vulnerability (ACV)
The most significant danger in trading extremes is stepping in front of a "falling knife" or a macro-liquidation cascade. The ACV Vault is a series of mathematical gates designed to lock the system down during these events:
The Pulse Engine: Measures the kinematic saturation (inertia) of the market. If downside momentum reaches maximum saturation, the system visually warns of a cascade and locks out bullish structural signals.
Effort vs. Result (Absorption): A volume-anomaly tracker. It requires proof that limit orders are absorbing the panic (e.g., a massive volume spike resulting in a tight doji candle) before validating a sweep.
Micro-Structure ChoCh: Requires the price to physically break the previous candle's pivot, proving a localized change of character.
How to Use This Indicator
This tool is designed to provide deep contextual awareness. Here is how to interpret its outputs:
AMD Sweep Markers (▲ / ▼): These markers print on the main chart when the criteria for an AMD liquidity sweep are perfectly met—meaning price has breached an accumulation zone, pierced the non-causal PRC boundary, and survived the ACV safety filters.
The Tactical HUD: The built-in dashboard provides real-time verdicts on the market's state. Monitor the "STATE" row:
ARMED: The market has hit a statistical extreme and is showing signs of structural absorption.
ACV LOCKDOWN: The market is in an uncontrolled freefall or blow-off top. Do not attempt to catch the extreme; wait for the Pulse Engine to decay and absorption to appear.
Subpane Kinematics: The lower oscillator pane visualizes the underlying market cycles using Nadaraya-Watson kernels and Hilbert Transforms, helping you identify phase shifts between bullish and bearish control.
Settings & Customization
Topological Window: Adjusts the primary lookback length for the baseline digital signal processing.
PRC Settings: Control the 'Degree' and 'Multiplier' of the Polynomial Regression Channel to suit the volatility of your specific asset.
ACV Handlers: You can individually toggle the safety filters (Time Exhaustion, G-Force Acceleration, Effort vs. Result) to make the indicator more or less restrictive based on your trading style.
Disclaimer: This script is strictly for educational and analytical purposes. Past performance of specific mathematical models does not guarantee future results in live trading environments.
Notas de prensa
Added alert system, this is a repainting indicator so be cautios.Script de código abierto
Fiel al espíritu de TradingView, el creador de este script lo ha convertido en código abierto, para que los traders puedan revisar y verificar su funcionalidad. ¡Enhorabuena al autor! Aunque puede utilizarlo de forma gratuita, recuerde que cualquier republicación del código está sujeta a nuestras Normas internas.

Exención de responsabilidad
La información y las publicaciones no constituyen, ni deben considerarse como, asesoramiento o recomendaciones financieras, de inversión, de trading u otro tipo, proporcionadas o respaldadas por TradingView. Obtenga más información en Condiciones de uso.
Script de código abierto
Fiel al espíritu de TradingView, el creador de este script lo ha convertido en código abierto, para que los traders puedan revisar y verificar su funcionalidad. ¡Enhorabuena al autor! Aunque puede utilizarlo de forma gratuita, recuerde que cualquier republicación del código está sujeta a nuestras Normas internas.
Exención de responsabilidad
La información y las publicaciones no constituyen, ni deben considerarse como, asesoramiento o recomendaciones financieras, de inversión, de trading u otro tipo, proporcionadas o respaldadas por TradingView. Obtenga más información en Condiciones de uso.