Multi-Symbol Trend Matrix
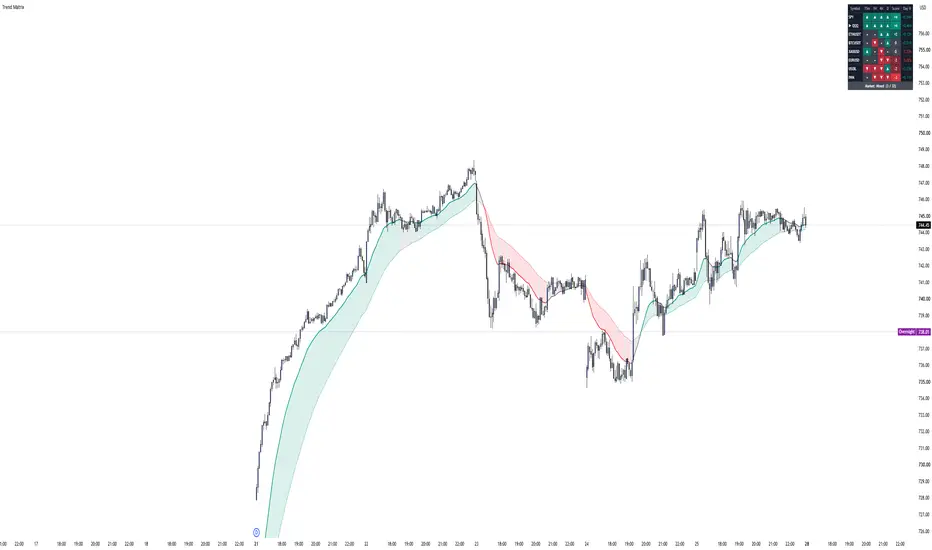
Multi-Symbol Trend Matrix shows the trend of up to 8 symbols across 4 timeframes in one table, so you can see at a glance what is trending, what is weak, and whether the overall market is risk-on or risk-off.
How it works:
Each symbol and timeframe is classified with the same rules as MTF Trend Dashboard:
- Bullish (▲): price above the fast EMA, fast EMA above the slow EMA, and RSI above 50
- Bearish (▼): price below the fast EMA, fast EMA below the slow EMA, and RSI below 50
- Neutral (•): anything else
Table:
- Score from -4 to +4 for each symbol (sum of all timeframes)
- Rows are sorted by score, strongest first (can be turned off)
- Daily % change for each symbol
- The current chart symbol is marked with ▶
- Market row: overall bias across all enabled symbols (risk-on, risk-off or mixed)
On the chart:
- Fast / slow EMA cloud colored by the current trend of the chart symbol
Alerts:
- A symbol becomes bullish or bearish on all 4 timeframes (checked on bar close)
Settings:
- Choose any 8 symbols (stocks, crypto, forex, futures, commodities) and enable or disable each one
- Change the 4 timeframes, EMA lengths and RSI length
- Table position, text size and colors
Default symbols: SPY, QQQ, IWM, BTCUSDT, ETHUSDT, XAUUSD, EURUSD, USOIL.
Note: values on higher timeframes update in real time and can change until the bar closes. This is a trend-analysis tool, not financial advice or a trading signal.
How it works:
Each symbol and timeframe is classified with the same rules as MTF Trend Dashboard:
- Bullish (▲): price above the fast EMA, fast EMA above the slow EMA, and RSI above 50
- Bearish (▼): price below the fast EMA, fast EMA below the slow EMA, and RSI below 50
- Neutral (•): anything else
Table:
- Score from -4 to +4 for each symbol (sum of all timeframes)
- Rows are sorted by score, strongest first (can be turned off)
- Daily % change for each symbol
- The current chart symbol is marked with ▶
- Market row: overall bias across all enabled symbols (risk-on, risk-off or mixed)
On the chart:
- Fast / slow EMA cloud colored by the current trend of the chart symbol
Alerts:
- A symbol becomes bullish or bearish on all 4 timeframes (checked on bar close)
Settings:
- Choose any 8 symbols (stocks, crypto, forex, futures, commodities) and enable or disable each one
- Change the 4 timeframes, EMA lengths and RSI length
- Table position, text size and colors
Default symbols: SPY, QQQ, IWM, BTCUSDT, ETHUSDT, XAUUSD, EURUSD, USOIL.
Note: values on higher timeframes update in real time and can change until the bar closes. This is a trend-analysis tool, not financial advice or a trading signal.

Exención de responsabilidad
La información y las publicaciones no constituyen, ni deben considerarse como, asesoramiento o recomendaciones financieras, de inversión, de trading u otro tipo, proporcionadas o respaldadas por TradingView. Obtenga más información en Condiciones de uso.
Exención de responsabilidad
La información y las publicaciones no constituyen, ni deben considerarse como, asesoramiento o recomendaciones financieras, de inversión, de trading u otro tipo, proporcionadas o respaldadas por TradingView. Obtenga más información en Condiciones de uso.