Order Flow PRO - Delta and Imbalance
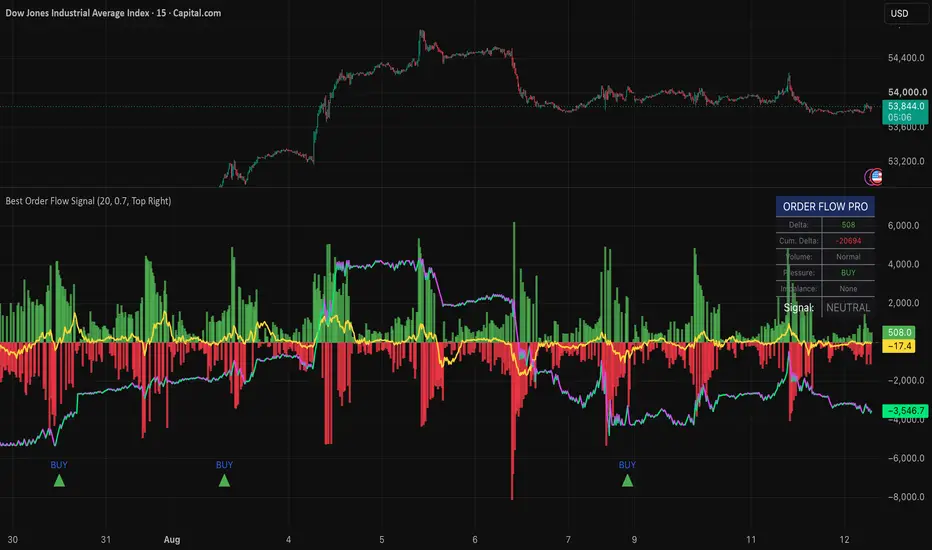
Order Flow PRO - Delta and Imbalance
OVERVIEW
Order Flow PRO is a volume-pressure panel for TradingView that visualizes estimated buying vs selling pressure per bar, cumulative delta, stacked imbalances, and price-delta divergence.
It helps assess whether price movement is supported by participation or developing under weakening internal conditions.
Important: TradingView does not provide true bid/ask transaction data for most instruments. Delta is estimated from bar structure and volume - not real institutional footprint.
Built by the Xcelerate Trade team.
━━━━━━━━━━━━━━━━━━━━━━━━━━━━━━━━━━━━━━━━
BEST USED WITH
━━━━━━━━━━━━━━━━━━━━━━━━━━━━━━━━━━━━━━━━
Works much better together with:
- Fluid Liquidity Zones - CHoCH + Mitigation + HTF | Xcelerate Trade
(or Fluid Liquidity Zones - CHoCH | Xcelerate Trade)
- Order Flow Footprint and Delta (OF1 / OF2 / OF3 overlay on chart)
Use SUPPLY / DEMAND zones + CHoCH / market structure first, then delta / imbalance as confirmation.
CONCEPT
Order flow analysis studies aggression and participation behind price. On TradingView, that is approximated from open/high/low/close and volume.
Use this indicator as a confluence layer after higher-level context (structure, liquidity zones, sessions) - not as a standalone entry system.
FEATURES
- Volume Delta histogram (green = bullish bar pressure, red = bearish)
- Delta MA smoothing line
- Cumulative Delta (normalized line)
- Stacked imbalance detection (3+ consecutive imbalance bars) - BUY / SELL markers
- Price-Delta divergence warnings
- Live dashboard: Delta, Cum. Delta, Volume, Pressure, Imbalance, Signal
- Dashboard position options and optional overlay on the price chart
- Alerts: stacked buy/sell imbalance, bullish/bearish divergence, extreme buying/selling pressure
HOW TO USE
1) Add the indicator on a separate pane below price (5m / 15m / 30m intraday)
2) Read Volume Delta for bar-by-bar pressure; use Cumulative Delta for session bias
3) Stacked imbalances: mark the zone, wait for pullback, confirm with structure - do not chase
4) Divergence: strongest near key levels + high volume; confirm with price action
5) Combine with Fluid Liquidity Zones and market structure before acting
RECOMMENDED SETTINGS
- Timeframes: 5m, 15m, 30m
- Delta MA Period: 20 (default)
- Imbalance Threshold: 0.7 (lower = more signals, noisier)
SKIP / AVOID
- Treating estimated delta as real bid/ask footprint
- Trading every imbalance or dashboard signal without structure context
- Ignoring high-impact news windows (volatility can distort delta)
- Using divergence alone as a guaranteed reversal call
LIMITATIONS
- Delta values are estimated due to platform data constraints.
- Results differ from platforms with exchange-level bid/ask feeds.
- Imbalance and divergence show structural conditions, not trade instructions.
- This script does not place trades and does not guarantee results.
- Always combine with your own risk management and market context.
OVERVIEW
Order Flow PRO is a volume-pressure panel for TradingView that visualizes estimated buying vs selling pressure per bar, cumulative delta, stacked imbalances, and price-delta divergence.
It helps assess whether price movement is supported by participation or developing under weakening internal conditions.
Important: TradingView does not provide true bid/ask transaction data for most instruments. Delta is estimated from bar structure and volume - not real institutional footprint.
Built by the Xcelerate Trade team.
━━━━━━━━━━━━━━━━━━━━━━━━━━━━━━━━━━━━━━━━
BEST USED WITH
━━━━━━━━━━━━━━━━━━━━━━━━━━━━━━━━━━━━━━━━
Works much better together with:
- Fluid Liquidity Zones - CHoCH + Mitigation + HTF | Xcelerate Trade
(or Fluid Liquidity Zones - CHoCH | Xcelerate Trade)
- Order Flow Footprint and Delta (OF1 / OF2 / OF3 overlay on chart)
Use SUPPLY / DEMAND zones + CHoCH / market structure first, then delta / imbalance as confirmation.
CONCEPT
Order flow analysis studies aggression and participation behind price. On TradingView, that is approximated from open/high/low/close and volume.
Use this indicator as a confluence layer after higher-level context (structure, liquidity zones, sessions) - not as a standalone entry system.
FEATURES
- Volume Delta histogram (green = bullish bar pressure, red = bearish)
- Delta MA smoothing line
- Cumulative Delta (normalized line)
- Stacked imbalance detection (3+ consecutive imbalance bars) - BUY / SELL markers
- Price-Delta divergence warnings
- Live dashboard: Delta, Cum. Delta, Volume, Pressure, Imbalance, Signal
- Dashboard position options and optional overlay on the price chart
- Alerts: stacked buy/sell imbalance, bullish/bearish divergence, extreme buying/selling pressure
HOW TO USE
1) Add the indicator on a separate pane below price (5m / 15m / 30m intraday)
2) Read Volume Delta for bar-by-bar pressure; use Cumulative Delta for session bias
3) Stacked imbalances: mark the zone, wait for pullback, confirm with structure - do not chase
4) Divergence: strongest near key levels + high volume; confirm with price action
5) Combine with Fluid Liquidity Zones and market structure before acting
RECOMMENDED SETTINGS
- Timeframes: 5m, 15m, 30m
- Delta MA Period: 20 (default)
- Imbalance Threshold: 0.7 (lower = more signals, noisier)
SKIP / AVOID
- Treating estimated delta as real bid/ask footprint
- Trading every imbalance or dashboard signal without structure context
- Ignoring high-impact news windows (volatility can distort delta)
- Using divergence alone as a guaranteed reversal call
LIMITATIONS
- Delta values are estimated due to platform data constraints.
- Results differ from platforms with exchange-level bid/ask feeds.
- Imbalance and divergence show structural conditions, not trade instructions.
- This script does not place trades and does not guarantee results.
- Always combine with your own risk management and market context.

Exención de responsabilidad
La información y las publicaciones no constituyen, ni deben considerarse como, asesoramiento o recomendaciones financieras, de inversión, de trading u otro tipo, proporcionadas o respaldadas por TradingView. Obtenga más información en Condiciones de uso.
Exención de responsabilidad
La información y las publicaciones no constituyen, ni deben considerarse como, asesoramiento o recomendaciones financieras, de inversión, de trading u otro tipo, proporcionadas o respaldadas por TradingView. Obtenga más información en Condiciones de uso.