OPEN-SOURCE SCRIPT
Dynamic Speed Pivot Supertrend [ZenAlphaAlgo]
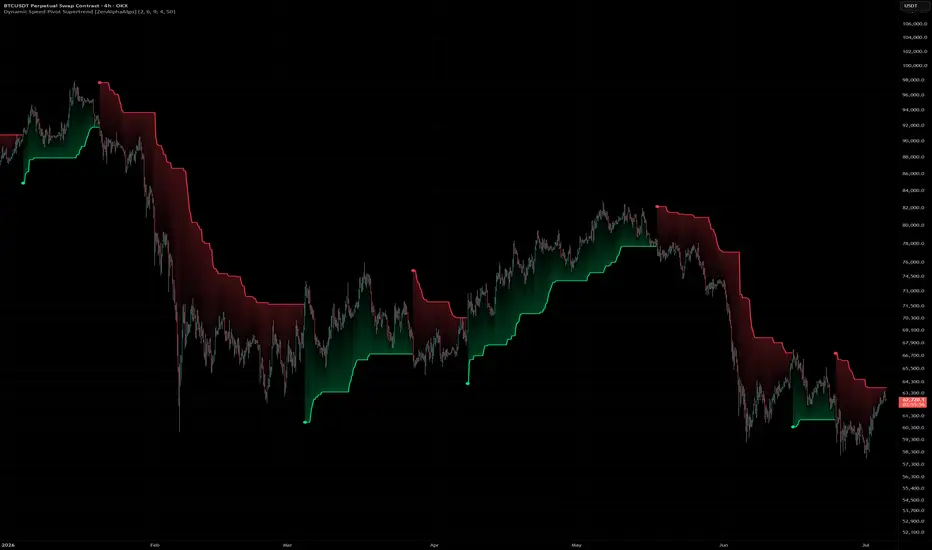
Overview
The Dynamic Speed Pivot Supertrend [ZenAlphaAlgo] is an advanced trend-following indicator designed to address the lag associated with pivot-based trailing stop losses. While pivot points excel at filtering noise and identifying significant trend structures, their delayed confirmation (e.g. waiting for $N$ bars to establish a pivot) can lead to late exits or entries when market velocity changes rapidly.
This script solves this problem by introducing a dynamic, momentum-based velocity factor that adaptively increases responsiveness during high-momentum moves while maintaining standard smoothing during sideways consolidation.
Credits & Attribution
The foundation of this script—calculating a Supertrend center line using weighted averages of pivot highs and lows—is based on the original work of LonesomeTheBlue (tradingview.com/u/LonesomeTheBlue/). We would like to credit them for their excellent contribution to the TradingView community.
This script modifies the original logic by introducing price velocity (ROC-based normalized speed) directly into the center line's smoothing calculation.
How it Works (Methodology)
The core feature of this indicator is Dynamic Speed Adaptive Smoothing:
How to Read Visual Cues (Interpretation)
Trailing Stop Line:
Stop Start Shapes (Circles): A circle is plotted directly on the trailing stop line at the exact bar a new trend begins (the trend flip point).
Buy/Sell Shapes:
Triangle Up (below bar): Plotted on a bullish trend flip (Buy signal).
Triangle Down (above bar): Plotted on a bearish trend flip (Sell signal).
Gradient Background Fill: A transparent color band spans between the trailing stop line and the closing price. The gradient starts translucent (75% transparency) at the stop line and fades out completely (100% transparency) towards the current price, indicating the safety buffer visually.
Center Line: The gray dotted line represents the adaptive center line around which the ATR bands are calculated.
Input Parameters Guide
Alerts
Disclaimer
This indicator is created for educational and analytical purposes only. Past performance does not guarantee future results. Trend-following indicators are subject to drawdowns during sideways/ranging market conditions. Always perform thorough backtesting and practice proper risk management.
The Dynamic Speed Pivot Supertrend [ZenAlphaAlgo] is an advanced trend-following indicator designed to address the lag associated with pivot-based trailing stop losses. While pivot points excel at filtering noise and identifying significant trend structures, their delayed confirmation (e.g. waiting for $N$ bars to establish a pivot) can lead to late exits or entries when market velocity changes rapidly.
This script solves this problem by introducing a dynamic, momentum-based velocity factor that adaptively increases responsiveness during high-momentum moves while maintaining standard smoothing during sideways consolidation.
Credits & Attribution
The foundation of this script—calculating a Supertrend center line using weighted averages of pivot highs and lows—is based on the original work of LonesomeTheBlue (tradingview.com/u/LonesomeTheBlue/). We would like to credit them for their excellent contribution to the TradingView community.
This script modifies the original logic by introducing price velocity (ROC-based normalized speed) directly into the center line's smoothing calculation.
How it Works (Methodology)
The core feature of this indicator is Dynamic Speed Adaptive Smoothing:
- Velocity Calculation: On every bar, the script computes the absolute Rate of Change (ROC) of the closing price over the specified "Speed Period (ROC)". This measures the speed of price movement.
- Normalization: The current ROC is normalized against the highest ROC value found within the "Max Speed Lookback" window. This divides the current speed by the highest speed observed in the lookback window, bounding the price velocity dynamically between 0.0 (fully flat/no movement) and 1.0 (maximum acceleration).
- Adaptive Smoothing: When a new pivot point is formed, the center line adjusts its position using an adaptive weighting calculation. If dynamic smoothing is enabled, the smoothing factor (Alpha) increases during high-velocity periods by selecting the maximum value between a baseline of 0.33 and the calculated normalized speed:
During High Acceleration (Alpha near 1.0): The center line reacts instantly to the new pivot point, rapidly tightening the trailing stop.
During Consolidation (Alpha at 0.33 baseline): The smoothing factor relaxes back to the stable baseline, preventing unnecessary whipsaws.
How to Read Visual Cues (Interpretation)
Trailing Stop Line:
- Lime Green Line: Represents an active bullish trend (long). Price is trading above the trailing stop.
- Red Line: Represents an active bearish trend (short). Price is trading below the trailing stop.
Stop Start Shapes (Circles): A circle is plotted directly on the trailing stop line at the exact bar a new trend begins (the trend flip point).
Buy/Sell Shapes:
Triangle Up (below bar): Plotted on a bullish trend flip (Buy signal).
Triangle Down (above bar): Plotted on a bearish trend flip (Sell signal).
Gradient Background Fill: A transparent color band spans between the trailing stop line and the closing price. The gradient starts translucent (75% transparency) at the stop line and fades out completely (100% transparency) towards the current price, indicating the safety buffer visually.
Center Line: The gray dotted line represents the adaptive center line around which the ATR bands are calculated.
Input Parameters Guide
- Pivot Point Period (default: 2): The number of left and right bars required to confirm a pivot high or low. Larger values filter more noise but increase confirmation delay.
- ATR Factor (default: 6.0): The multiplier applied to the Average True Range (ATR) to determine the distance of the bands from the center line.
- ATR Period (default: 9): The lookback window for the ATR volatility calculation.
- Use Dynamic Center Line Smoothing (default: true): Toggles between the dynamic momentum-based smoothing coefficient and the static 0.33 smoothing.
- Speed Period (ROC) (default: 4): The lookback window for the Rate of Change calculation used to determine current price speed.
- Max Speed Lookback (default: 50): The lookback window used to establish the maximum historical speed for normalization.
- Display & Styling: Toggles to independently show or hide the Trailing Stop line, the Center line, the buy/sell shapes, or the background gradient fill.
Alerts
- Alert Conditions: Standard alert triggers are available via the TradingView Alert Dialog for both Buy / Bullish Trend Flip and Sell / Bearish Trend Flip.
- Dynamic Alerts: Script-based dynamic alerts trigger on the bar close when a trend flip occurs.
Disclaimer
This indicator is created for educational and analytical purposes only. Past performance does not guarantee future results. Trend-following indicators are subject to drawdowns during sideways/ranging market conditions. Always perform thorough backtesting and practice proper risk management.
Script de código abierto
Fiel al espíritu de TradingView, el creador de este script lo ha convertido en código abierto, para que los traders puedan revisar y verificar su funcionalidad. ¡Enhorabuena al autor! Aunque puede utilizarlo de forma gratuita, recuerde que cualquier republicación del código está sujeta a nuestras Normas internas.

Learn more about our framework.
Analyze your strategies using Monte Carlo Test at ZenAlpha.io
Analyze your strategies using Monte Carlo Test at ZenAlpha.io
Exención de responsabilidad
La información y las publicaciones no constituyen, ni deben considerarse como, asesoramiento o recomendaciones financieras, de inversión, de trading u otro tipo, proporcionadas o respaldadas por TradingView. Obtenga más información en Condiciones de uso.
Script de código abierto
Fiel al espíritu de TradingView, el creador de este script lo ha convertido en código abierto, para que los traders puedan revisar y verificar su funcionalidad. ¡Enhorabuena al autor! Aunque puede utilizarlo de forma gratuita, recuerde que cualquier republicación del código está sujeta a nuestras Normas internas.
Learn more about our framework.
Analyze your strategies using Monte Carlo Test at ZenAlpha.io
Analyze your strategies using Monte Carlo Test at ZenAlpha.io
Exención de responsabilidad
La información y las publicaciones no constituyen, ni deben considerarse como, asesoramiento o recomendaciones financieras, de inversión, de trading u otro tipo, proporcionadas o respaldadas por TradingView. Obtenga más información en Condiciones de uso.