Liquidity Trap Detector [BOSWaves]
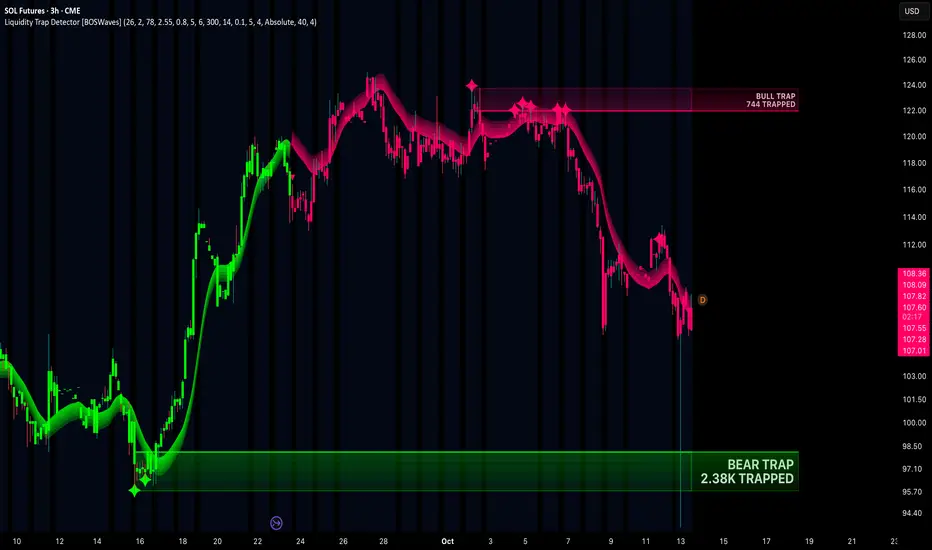
Liquidity Trap Detector [BOSWaves] - Failed Breakout Detection with Trapped Volume Measurement, DEMA Trend Filtering, and Trend-Aligned Zone Retests
Overview
Liquidity Trap Detector [BOSWaves] is a failed breakout detection system that tracks confirmed swing highs and lows as liquidity levels, identifies breakouts that close beyond those levels by an ATR-based buffer, and confirms a trap when price closes back through the broken level within a configurable window. Each confirmed trap is converted into a zone spanning the broken level and the most extreme price reached during the failed breakout, labeled with the total volume transacted while participants were on the wrong side of the move.

Instead of treating every breakout as a continuation signal, each break of a swing level is monitored for acceptance or rejection. If price holds beyond the level for the full trap window, the breakout is accepted and the level is discarded. If price closes back through the level within the window, the breakout has failed, the participants who entered on the break are now trapped, and a zone is created to mark where that trapped positioning sits. A DEMA-based trend engine runs alongside the trap logic, providing directional context through a layered gradient, trend-colored candles, and flip markers, and filtering zone retest signals so that only retests aligned with the prevailing trend are marked on the chart.
This creates a liquidity framework that bridges level detection, trap confirmation, and trend context within a single indicator. The trap zones show where breakout traders were caught, the trapped volume reading quantifies how much participation was involved, and the trend engine identifies which of those zones are positioned to act in the direction of the broader move when price returns to them.
Price is therefore evaluated not just for whether it broke a level, but for whether that break was accepted or rejected, how much volume was caught on the wrong side, and whether a return to the resulting zone aligns with the prevailing trend.
Conceptual Framework
Liquidity Trap Detector is founded on the principle that a failed breakout is often more informative than a successful one. When price breaks a swing level and quickly reverses back through it, the participants who bought the breakout or sold the breakdown are left holding losing positions, and the zone where they entered becomes a reference for future reactions.
Traditional breakout tools mark the break itself and leave the trader to judge whether it will follow through. This framework closes that gap by tracking every break through a defined acceptance window, confirming only the breakouts that fail, measuring the volume transacted during the failed move, and maintaining each resulting trap zone until it is either retested or invalidated. A separate trend engine supplies directional context, so trap zones can be evaluated relative to the broader move rather than in isolation.
Three core principles guide the design:
This shifts breakout analysis from a binary break or no-break reading into a structured assessment of breakout failure, trapped participation, and trend-aligned zone interaction.
Theoretical Foundation
The indicator combines double exponential moving average calculation for trend baseline construction, ATR-scaled flip thresholds with slope confirmation for trend state, pivot-based swing detection for liquidity level identification, ATR-buffered breakout detection, window-bounded failure confirmation, cumulative volume measurement across the failed move, zone construction from the broken level to the excursion extreme, and an armed retest system that requires price to clear a zone before a return to it is registered.
The trend baseline is a DEMA of the HLC3 source with optional additional EMA smoothing. The trend flips bullish only when price closes above the baseline plus the configured ATR multiple while the baseline is rising, and flips bearish only when price closes below the baseline minus the configured ATR multiple while the baseline is falling. Breakouts require a close beyond the swing level plus the ATR break buffer, while trap confirmation only requires a close back through the level itself, so the rejection condition is less demanding than the breakout condition.
Four internal systems operate in tandem:
This design ensures that trap detection, trapped volume measurement, and trend context are evaluated together, while zone management keeps only the most recent valid zones on the chart.
How It Works
Liquidity Trap Detector evaluates price through a sequence of trend, level, and trap processes:
Together, these elements form a continuously updating map of failed breakouts, trapped participation, and trend context, with retests filtered to the direction of the prevailing move.
Interpretation
Liquidity Trap Detector should be interpreted as a failed breakout framework with an attached trend filter:
Trap zones, trapped volume, and trend state collectively communicate more breakout and liquidity context than any element in isolation.
Signal Logic & Visual Cues
Liquidity Trap Detector presents two signal types on the chart:
Trap confirmation itself is shown by the appearance of a new zone rather than a separate marker. Retests of zones that run against the current trend are not marked on the chart.
Alert generation covers bullish and bearish trend flips, bull trap and bear trap confirmations, and trap zone retests. The retest alert fires on any retest regardless of trend direction, while the chart markers show only trend-aligned retests.
Strategy Integration
Liquidity Trap Detector fits within liquidity sweep, failed breakout, and trend-continuation pullback approaches:
Technical Implementation Details
Optimal Application Parameters
Timeframe Guidance:
Suggested Baseline Configuration:
These suggested parameters should be used as a baseline; their effectiveness depends on the instrument's volatility characteristics, swing structure frequency, volume data quality, and preferred signal sensitivity, so fine-tuning is expected for optimal performance.
Parameter Calibration Notes
Use the following adjustments to refine behavior without altering the core logic:
Adjustments should be incremental and evaluated across multiple session types rather than isolated market conditions.
Performance Characteristics
High Effectiveness:
Reduced Effectiveness:
Integration Guidelines
Disclaimer
Liquidity Trap Detector [BOSWaves] is a professional-grade failed breakout detection and liquidity zone visualization tool. It uses ATR-buffered breakout monitoring, trapped volume measurement, and DEMA trend filtering but does not predict future price movements. Results depend on market conditions, instrument liquidity characteristics, volume data quality, parameter selection, and disciplined execution. BOSWaves recommends deploying this indicator within a broader analytical framework that incorporates order flow context, structural analysis, and comprehensive risk management.
Overview
Liquidity Trap Detector [BOSWaves] is a failed breakout detection system that tracks confirmed swing highs and lows as liquidity levels, identifies breakouts that close beyond those levels by an ATR-based buffer, and confirms a trap when price closes back through the broken level within a configurable window. Each confirmed trap is converted into a zone spanning the broken level and the most extreme price reached during the failed breakout, labeled with the total volume transacted while participants were on the wrong side of the move.
Instead of treating every breakout as a continuation signal, each break of a swing level is monitored for acceptance or rejection. If price holds beyond the level for the full trap window, the breakout is accepted and the level is discarded. If price closes back through the level within the window, the breakout has failed, the participants who entered on the break are now trapped, and a zone is created to mark where that trapped positioning sits. A DEMA-based trend engine runs alongside the trap logic, providing directional context through a layered gradient, trend-colored candles, and flip markers, and filtering zone retest signals so that only retests aligned with the prevailing trend are marked on the chart.
This creates a liquidity framework that bridges level detection, trap confirmation, and trend context within a single indicator. The trap zones show where breakout traders were caught, the trapped volume reading quantifies how much participation was involved, and the trend engine identifies which of those zones are positioned to act in the direction of the broader move when price returns to them.
Price is therefore evaluated not just for whether it broke a level, but for whether that break was accepted or rejected, how much volume was caught on the wrong side, and whether a return to the resulting zone aligns with the prevailing trend.
Conceptual Framework
Liquidity Trap Detector is founded on the principle that a failed breakout is often more informative than a successful one. When price breaks a swing level and quickly reverses back through it, the participants who bought the breakout or sold the breakdown are left holding losing positions, and the zone where they entered becomes a reference for future reactions.
Traditional breakout tools mark the break itself and leave the trader to judge whether it will follow through. This framework closes that gap by tracking every break through a defined acceptance window, confirming only the breakouts that fail, measuring the volume transacted during the failed move, and maintaining each resulting trap zone until it is either retested or invalidated. A separate trend engine supplies directional context, so trap zones can be evaluated relative to the broader move rather than in isolation.
Three core principles guide the design:
- A breakout should only be classified as a trap when price closes beyond a confirmed swing level by a measurable ATR buffer and then closes back through that level within a defined window, separating genuine failed breakouts from minor wicks and noise.
- The significance of each trap should be quantified by the volume transacted from the breakout bar through the confirmation bar, providing a direct measure of how much participation was caught on the wrong side of the move.
- Trap zone retests should be filtered by the prevailing trend, so that only returns to zones positioned in the direction of the broader move are highlighted as actionable reactions.
This shifts breakout analysis from a binary break or no-break reading into a structured assessment of breakout failure, trapped participation, and trend-aligned zone interaction.
Theoretical Foundation
The indicator combines double exponential moving average calculation for trend baseline construction, ATR-scaled flip thresholds with slope confirmation for trend state, pivot-based swing detection for liquidity level identification, ATR-buffered breakout detection, window-bounded failure confirmation, cumulative volume measurement across the failed move, zone construction from the broken level to the excursion extreme, and an armed retest system that requires price to clear a zone before a return to it is registered.
The trend baseline is a DEMA of the HLC3 source with optional additional EMA smoothing. The trend flips bullish only when price closes above the baseline plus the configured ATR multiple while the baseline is rising, and flips bearish only when price closes below the baseline minus the configured ATR multiple while the baseline is falling. Breakouts require a close beyond the swing level plus the ATR break buffer, while trap confirmation only requires a close back through the level itself, so the rejection condition is less demanding than the breakout condition.
Four internal systems operate in tandem:
- DEMA Trend Engine: Calculates the DEMA baseline from HLC3 with optional smoothing, derives upper and lower flip thresholds from a long-period ATR, and flips trend state only when price closes beyond the threshold with the baseline sloping in the new direction. Trend state drives the gradient, candle coloring, flip markers, and retest filtering.
- Level Tracking System: Detects swing highs and lows using the configured swing length, stores up to the configured number of levels per side with the oldest discarded first, removes unbroken levels that exceed the maximum age, and monitors each level for an ATR-buffered breakout.
- Trap Confirmation Engine: Once a level breaks, tracks the most extreme price reached and accumulates volume on every bar of the excursion. If price closes back through the level within the trap window, the trap is confirmed and a zone is created. If the window expires without a return, the breakout is accepted and the level is discarded.
- Zone Management System: Stores active trap zones per side up to the configured limit, optionally replaces overlapping zones, removes zones when price closes beyond the mitigation level, and tracks an armed state so that a retest is registered only after price has fully cleared the zone and then returned to it.
This design ensures that trap detection, trapped volume measurement, and trend context are evaluated together, while zone management keeps only the most recent valid zones on the chart.
How It Works
Liquidity Trap Detector evaluates price through a sequence of trend, level, and trap processes:
- DEMA Baseline: A double exponential moving average of HLC3 is calculated over the configured length, with optional EMA smoothing applied to the result.
- Trend Flip Detection: A bullish flip requires a close above the baseline plus the flip threshold ATR multiple while the baseline is rising. A bearish flip requires a close below the baseline minus the flip threshold while the baseline is falling. The initial trend is set by the close relative to the baseline.
- Trend Gradient: Five fill layers extend from the baseline away from price by the configured gradient width in ATR, drawn below the baseline in bullish trends and above it in bearish trends, with opacity fading from the baseline outward.
- Level Detection: Swing highs and lows are confirmed when a bar's high or low is the extreme across the configured swing length on both sides, introducing a confirmation delay equal to the swing length. Each confirmed swing is stored as a liquidity level.
- Breakout Detection: A swing high is broken when price closes above it by more than the break buffer multiplied by ATR. A swing low is broken when price closes below it by the same margin. The breakout bar's high or low and its volume are recorded.
- Excursion Tracking: On each subsequent bar, the most extreme price reached beyond the level is updated and the bar's volume is added to the trapped volume total.
- Trap Confirmation: If price closes back through the broken level within the trap window, the trap is confirmed. A failed break above a swing high is a bull trap. A failed break below a swing low is a bear trap.
- Breakout Acceptance: If the trap window expires without a close back through the level, the breakout is treated as accepted and the level is discarded without creating a zone.
- Zone Construction: Each trap creates a zone from the broken level to the excursion extreme, starting at the breakout bar. When Hide Overlap is enabled, an existing same-side zone that overlaps the new one is removed. The oldest zone is removed once the per-side limit is exceeded.
- Mitigation: In Absolute mode, a bull trap zone is invalidated when price closes above its top and a bear trap zone when price closes below its bottom. In Middle mode, a close beyond the zone midpoint invalidates it. Invalidated zones are removed from the chart.
- Retest Detection: A zone becomes armed once a bar trades entirely outside it on the side price returned to. The next bar that touches the zone registers a retest and disarms it until price clears the zone again. Retest markers are plotted only when the retest aligns with the current trend.
- Zone Rendering: Each zone is drawn with gradient layers that are most opaque at the broken level and fade toward the trap extreme, a solid trigger line at the broken level, a faint far-edge line at the trap extreme, and the trap type with trapped volume displayed in the projected section of the zone.
Together, these elements form a continuously updating map of failed breakouts, trapped participation, and trend context, with retests filtered to the direction of the prevailing move.
Interpretation
Liquidity Trap Detector should be interpreted as a failed breakout framework with an attached trend filter:
- Bull Trap Zone (Red/Pink): Created when price breaks above a swing high and closes back below it within the trap window. The zone spans the broken swing high to the highest price reached during the failed breakout, marking where breakout buyers were trapped.
- Bear Trap Zone (Green): Created when price breaks below a swing low and closes back above it within the trap window. The zone spans the broken swing low to the lowest price reached during the failed breakdown, marking where breakdown sellers were trapped.
- Trigger Line: The solid line at the broken swing level, representing the edge of the zone nearest to current price and the level that price closed back through to confirm the trap.
- Far Edge: The faint line at the trap extreme, representing the furthest point of the failed breakout. In Absolute mitigation mode, a close beyond this edge invalidates the zone.
- Zone Gradient: Layers inside each zone are most opaque at the trigger line and fade toward the far edge, emphasizing the broken level as the primary reaction reference within the zone.
- Trapped Volume: The figure displayed inside each zone shows the total volume transacted from the breakout bar through the confirmation bar, abbreviated in thousands, millions, or billions. Higher readings indicate greater participation caught on the wrong side of the move.
- Trend Gradient: The layered fill beside the DEMA baseline shows the current trend direction, positioned below the baseline in bullish trends and above it in bearish trends.
- Candle Coloring: Candles are colored by the current trend state, providing a bar-level reading of the prevailing direction.
- Zone Removal: Zones disappear from the chart when they are mitigated, replaced by an overlapping zone, or pushed out by the per-side zone limit.
Trap zones, trapped volume, and trend state collectively communicate more breakout and liquidity context than any element in isolation.
Signal Logic & Visual Cues
Liquidity Trap Detector presents two signal types on the chart:
- Trend Flip Signals (▲ / ▼): Green triangle below the bar when the trend flips bullish and red triangle above the bar when the trend flips bearish, each requiring a close beyond the ATR flip threshold with the DEMA baseline sloping in the new direction.
- Trend-Aligned Retest Signals (✦): Green marker at the bar low when price retests an armed bear trap zone during a bullish trend, and red marker at the bar high when price retests an armed bull trap zone during a bearish trend.
Trap confirmation itself is shown by the appearance of a new zone rather than a separate marker. Retests of zones that run against the current trend are not marked on the chart.
Alert generation covers bullish and bearish trend flips, bull trap and bear trap confirmations, and trap zone retests. The retest alert fires on any retest regardless of trend direction, while the chart markers show only trend-aligned retests.
Strategy Integration
Liquidity Trap Detector fits within liquidity sweep, failed breakout, and trend-continuation pullback approaches:
- Trend-Aligned Trap Retests: Use the retest markers as the primary reaction signals. A bear trap zone retested during a bullish trend combines trapped selling below the level with a supportive trend, while a bull trap zone retested during a bearish trend combines trapped buying above the level with a declining trend.
- Trapped Volume Weighting: Compare trapped volume readings across active zones. Zones created from failed breakouts with heavy participation carry more significance than zones created from low-volume excursions.
- Breakout Validation: Use trap confirmations as evidence against continuation. A swing level that is broken and then reclaimed within the window suggests the breakout lacked acceptance, warranting caution before trading in the direction of the original break.
- Defined Invalidation: Use the far edge of each zone as a structural reference for invalidation. In Absolute mode, a close beyond the trap extreme removes the zone, indicating the trapped positioning has been resolved.
- Trend Context for Counter-Trend Traps: Treat trap zones that oppose the current trend as context rather than signals. Their retests are excluded from the chart markers, and they are more likely to be mitigated if the prevailing trend continues.
- Multi-Timeframe Liquidity Alignment: Apply higher-timeframe trap zones and trend state as the primary reference, engaging with lower-timeframe retests only when they occur in the same direction as the higher-timeframe structure.
Technical Implementation Details
- Trend Engine: DEMA of HLC3 with optional EMA smoothing; long-period ATR flip thresholds; baseline slope confirmation required for each trend flip
- Level System: Pivot-based swing high and low detection; per-side level storage with oldest-first removal; age-based expiry for unbroken levels
- Trap Engine: ATR-buffered breakout detection; excursion extreme tracking; cumulative volume from breakout bar through confirmation bar; window-bounded failure confirmation with acceptance-based level removal
- Zone System: Zones from broken level to excursion extreme; optional same-side overlap replacement; per-side zone limit; Absolute or Middle mitigation with removal on invalidation
- Retest System: Armed state set when price fully clears a zone; retest registered on the next touch; re-arming required between retests; chart markers filtered by trend state
- Visualization: Five-layer trend gradient; trend-colored candles; flip triangles; configurable gradient layers within each zone; trigger and far-edge lines; projected zone extension with trap type and abbreviated trapped volume text
- Performance Profile: Level, trap, mitigation, and retest logic evaluated on every bar; zone drawing objects created when a trap is confirmed, positioned on the last bar, and deleted when a zone is removed
Optimal Application Parameters
Timeframe Guidance:
- 1 - 5 min: Intraday liquidity sweep detection with shorter swing length and a tight trap window to capture fast stop runs and rapid reclaims
- 15 - 60 min: Session-level failed breakout analysis with balanced swing length and moderate break buffer for meaningful level selection across typical session moves
- 4H - Daily: Swing-level trap identification with longer swing length and a wider trap window to allow slower failed breakouts to develop before confirmation
Suggested Baseline Configuration:
- DEMA Length: 26
- DEMA Smoothing: 2
- Trend ATR Length: 78
- Flip Threshold ATR: 2.55
- Gradient Width ATR: 0.8
- Swing Length: 5
- Levels Per Side: 6
- Level Max Age: 300
- Trap ATR Length: 14
- Break Buffer: 0.1
- Trap Window: 5
- Zones Per Side: 4
- Mitigation: Absolute
- Hide Overlap: Enabled
- Zone Extension: 40
- Trap Gradient Layers: 4
- Show Trend Gradient: Enabled
- Color Candles: Enabled (requires disabling original chart candles in chart settings)
- Show Trend Flips: Enabled
- Show Trap Text: Enabled
- Show Trapped Volume: Enabled
These suggested parameters should be used as a baseline; their effectiveness depends on the instrument's volatility characteristics, swing structure frequency, volume data quality, and preferred signal sensitivity, so fine-tuning is expected for optimal performance.
Parameter Calibration Notes
Use the following adjustments to refine behavior without altering the core logic:
- Too many traps: Increase Break Buffer to require a more decisive breakout before monitoring begins, increase Swing Length so only more significant levels are tracked, or decrease Trap Window so only rapid reclaims qualify as traps.
- Too few traps: Decrease Break Buffer toward 0 so smaller breaks are monitored, increase Trap Window to allow slower failures, or increase Levels Per Side and Level Max Age so more levels remain eligible.
- Zones invalidated too quickly: Use Absolute mitigation so zones remain active until price closes beyond the trap extreme rather than the midpoint.
- Zones persisting too long: Use Middle mitigation so zones are removed once price closes through half of the zone.
- Chart too cluttered: Reduce Zones Per Side and keep Hide Overlap enabled so overlapping zones are consolidated.
- Trend flipping too often: Increase Flip Threshold ATR or DEMA Length to require stronger, more sustained displacement before the trend changes.
- Trend too slow to flip: Decrease Flip Threshold ATR or DEMA Length. The default threshold is deliberately wide relative to a long-period ATR, so the trend responds to sustained moves rather than short-term swings.
- Few retest markers: Retest markers are only plotted when the retest aligns with the current trend. Use the Trap Retest alert to monitor all retests regardless of direction.
- Trapped volume not displayed: The volume reading only appears when the instrument provides volume data and Show Trap Text is enabled.
Adjustments should be incremental and evaluated across multiple session types rather than isolated market conditions.
Performance Characteristics
High Effectiveness:
- Markets where price frequently sweeps swing highs and lows before reversing, producing clear failed breakouts with defined excursion extremes
- Trending markets with pullbacks into trap zones that formed in the direction of the trend, where trend-aligned retests combine trapped positioning with directional support
- Instruments with reliable volume data, where the trapped volume reading provides a meaningful comparison of participation across zones
- Liquidity-driven environments where stop runs beyond obvious swing levels are common and quickly reclaimed
Reduced Effectiveness:
- Strong impulsive trends where breakouts are consistently accepted, producing few traps, while counter-trend trap zones are frequently mitigated
- Instruments without volume data, where the trapped volume metric is unavailable and zones must be assessed by structure alone
- Very low volatility environments where the ATR-based break buffer is small, allowing minor breaks and reclaims to qualify as traps
- Gap-heavy or news-driven instruments where breaks and reclaims occur through gaps, producing oversized zones with extremes that do not reflect tradable prices
- Choppy markets where the trend engine lags rapid direction changes, filtering out retests that would otherwise be marked
Integration Guidelines
- Confluence: Combine with BOSWaves structural, momentum, or order flow tools to validate trap zone reactions and assess whether retests align with broader market context
- Volume Assessment: Compare trapped volume across active zones before prioritizing reactions. Zones with substantially higher trapped volume reflect larger failed participation and warrant greater attention.
- Trend Discipline: Favor retests that align with the current trend state. Counter-trend trap zones remain useful as context but are excluded from retest markers by design.
- Mitigation Awareness: Note the selected mitigation mode when evaluating zones. Middle mode removes zones earlier, while Absolute mode keeps them active until the trap extreme is breached.
- Retest Sequencing: Each retest disarms the zone until price clears it again. A zone that has already been retested multiple times may carry less remaining trapped positioning than a fresh zone receiving its first retest.
Disclaimer
Liquidity Trap Detector [BOSWaves] is a professional-grade failed breakout detection and liquidity zone visualization tool. It uses ATR-buffered breakout monitoring, trapped volume measurement, and DEMA trend filtering but does not predict future price movements. Results depend on market conditions, instrument liquidity characteristics, volume data quality, parameter selection, and disciplined execution. BOSWaves recommends deploying this indicator within a broader analytical framework that incorporates order flow context, structural analysis, and comprehensive risk management.

Exención de responsabilidad
La información y las publicaciones no constituyen, ni deben considerarse como, asesoramiento o recomendaciones financieras, de inversión, de trading u otro tipo, proporcionadas o respaldadas por TradingView. Obtenga más información en Condiciones de uso.
Exención de responsabilidad
La información y las publicaciones no constituyen, ni deben considerarse como, asesoramiento o recomendaciones financieras, de inversión, de trading u otro tipo, proporcionadas o respaldadas por TradingView. Obtenga más información en Condiciones de uso.