OPEN-SOURCE SCRIPT
Thermal Candlestick Spectrogram [Jamallo]
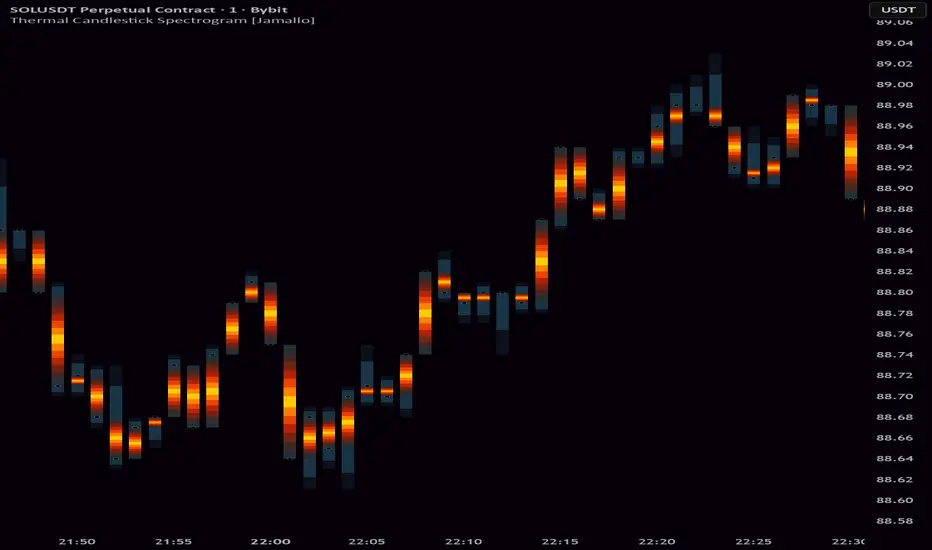
The Thermal Candlestick Spectrogram replaces flat, binary candlesticks with a heat-mapped view of price density. Every bar radiates outward from a white-hot core through layers of orange, red, and deep amber — the same way thermal imaging reveals intensity beneath a surface. The result is a chart that doesn't just show you what price did, it shows you how concentrated that move was.
How It Works
A 7-layer gradient stack is anchored to each candle's midpoint and expands symmetrically toward the edges of the body. Transparency increases with each outer layer, creating a natural falloff that mimics heat dissipation:
White-yellow core — maximum density at the center of the body
Orange-red mantle — transitional layers that reveal the spread of price action
Dark outer boundary — a near-transparent edge that lets candles breathe without hard lines
Fading wicks — a dual-layer vertical fade that tapers wicks naturally toward the High and Low extremes, reducing visual noise
Anti-aliased price dot — a precision close marker with a subtle white halo for clean real-time tracking
Design & Performance
The entire effect runs on a fixed 9-plot architecture (7 body layers + 2 wick layers), keeping script weight low and render performance stable even alongside other indicators. No dynamic loops, no repainting — just a clean, deterministic stack that works across all timeframes and instruments.
Visual Comparison

Traditional flat candles vs. the Thermal Spectrogram — same data, entirely different depth.
How It Works
A 7-layer gradient stack is anchored to each candle's midpoint and expands symmetrically toward the edges of the body. Transparency increases with each outer layer, creating a natural falloff that mimics heat dissipation:
White-yellow core — maximum density at the center of the body
Orange-red mantle — transitional layers that reveal the spread of price action
Dark outer boundary — a near-transparent edge that lets candles breathe without hard lines
Fading wicks — a dual-layer vertical fade that tapers wicks naturally toward the High and Low extremes, reducing visual noise
Anti-aliased price dot — a precision close marker with a subtle white halo for clean real-time tracking
Design & Performance
The entire effect runs on a fixed 9-plot architecture (7 body layers + 2 wick layers), keeping script weight low and render performance stable even alongside other indicators. No dynamic loops, no repainting — just a clean, deterministic stack that works across all timeframes and instruments.
Visual Comparison
Traditional flat candles vs. the Thermal Spectrogram — same data, entirely different depth.
Script de código abierto
Fiel al espíritu de TradingView, el creador de este script lo ha convertido en código abierto, para que los traders puedan revisar y verificar su funcionalidad. ¡Enhorabuena al autor! Aunque puede utilizarlo de forma gratuita, recuerde que cualquier republicación del código está sujeta a nuestras Normas internas.

Join the Growing (Econophysics Trading) Community! ⚛️
discord.com/invite/qb4RKFdwYJ
Trade the physics of price.
discord.com/invite/qb4RKFdwYJ
Trade the physics of price.
Exención de responsabilidad
La información y las publicaciones no constituyen, ni deben considerarse como, asesoramiento o recomendaciones financieras, de inversión, de trading u otro tipo, proporcionadas o respaldadas por TradingView. Obtenga más información en Condiciones de uso.
Script de código abierto
Fiel al espíritu de TradingView, el creador de este script lo ha convertido en código abierto, para que los traders puedan revisar y verificar su funcionalidad. ¡Enhorabuena al autor! Aunque puede utilizarlo de forma gratuita, recuerde que cualquier republicación del código está sujeta a nuestras Normas internas.
Join the Growing (Econophysics Trading) Community! ⚛️
discord.com/invite/qb4RKFdwYJ
Trade the physics of price.
discord.com/invite/qb4RKFdwYJ
Trade the physics of price.
Exención de responsabilidad
La información y las publicaciones no constituyen, ni deben considerarse como, asesoramiento o recomendaciones financieras, de inversión, de trading u otro tipo, proporcionadas o respaldadas por TradingView. Obtenga más información en Condiciones de uso.