OPEN-SOURCE SCRIPT
NIFTY 100-500 Levels
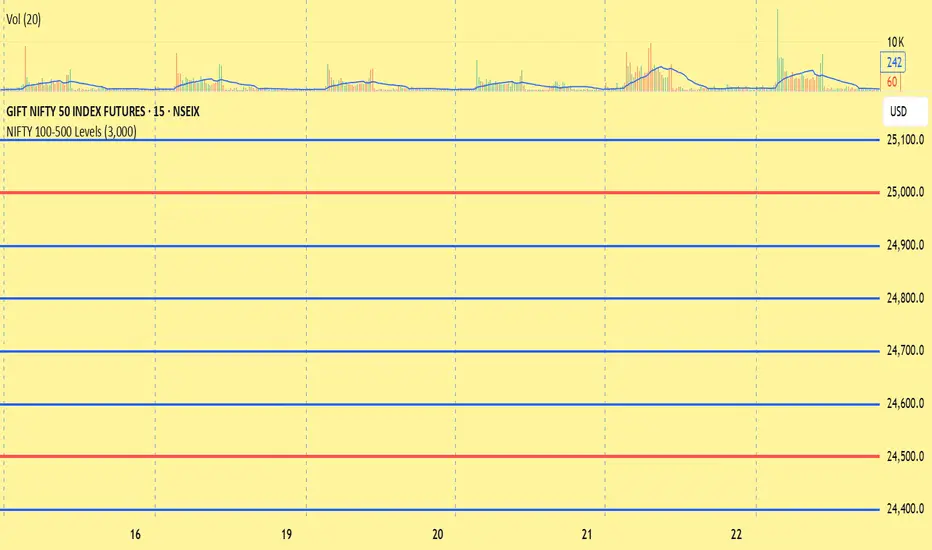
This indicator plots psychological price levels for NIFTY 50 and other indices/stocks using automatic horizontal support and resistance zones.
Features
🔵 Blue horizontal lines every 100 points
🔴 Red horizontal lines every 500 points
Automatic level plotting around current market price
Helps identify:
Psychological support & resistance
Intraday reaction zones
Breakout and reversal areas
Option strike importance levels
Example
23500 → Red major level
23600 → Blue minor level
23700 → Blue minor level
23800 → Blue minor level
23900 → Blue minor level
24000 → Red major level
Best Used For
NIFTY
BANKNIFTY
Index trading
Scalping
Intraday trading
Swing trading
Major 500-point levels are highlighted with thicker red lines for better visibility, while intermediate 100-point levels are shown in blue to maintain chart clarity.
Features
🔵 Blue horizontal lines every 100 points
🔴 Red horizontal lines every 500 points
Automatic level plotting around current market price
Helps identify:
Psychological support & resistance
Intraday reaction zones
Breakout and reversal areas
Option strike importance levels
Example
23500 → Red major level
23600 → Blue minor level
23700 → Blue minor level
23800 → Blue minor level
23900 → Blue minor level
24000 → Red major level
Best Used For
NIFTY
BANKNIFTY
Index trading
Scalping
Intraday trading
Swing trading
Major 500-point levels are highlighted with thicker red lines for better visibility, while intermediate 100-point levels are shown in blue to maintain chart clarity.
Script de código abierto
Fiel al espíritu de TradingView, el creador de este script lo ha convertido en código abierto, para que los traders puedan revisar y verificar su funcionalidad. ¡Enhorabuena al autor! Aunque puede utilizarlo de forma gratuita, recuerde que cualquier republicación del código está sujeta a nuestras Normas internas.

Exención de responsabilidad
La información y las publicaciones no constituyen, ni deben considerarse como, asesoramiento o recomendaciones financieras, de inversión, de trading u otro tipo, proporcionadas o respaldadas por TradingView. Obtenga más información en Condiciones de uso.
Script de código abierto
Fiel al espíritu de TradingView, el creador de este script lo ha convertido en código abierto, para que los traders puedan revisar y verificar su funcionalidad. ¡Enhorabuena al autor! Aunque puede utilizarlo de forma gratuita, recuerde que cualquier republicación del código está sujeta a nuestras Normas internas.
Exención de responsabilidad
La información y las publicaciones no constituyen, ni deben considerarse como, asesoramiento o recomendaciones financieras, de inversión, de trading u otro tipo, proporcionadas o respaldadas por TradingView. Obtenga más información en Condiciones de uso.