OPEN-SOURCE SCRIPT
Raid Clock+ (M1D)
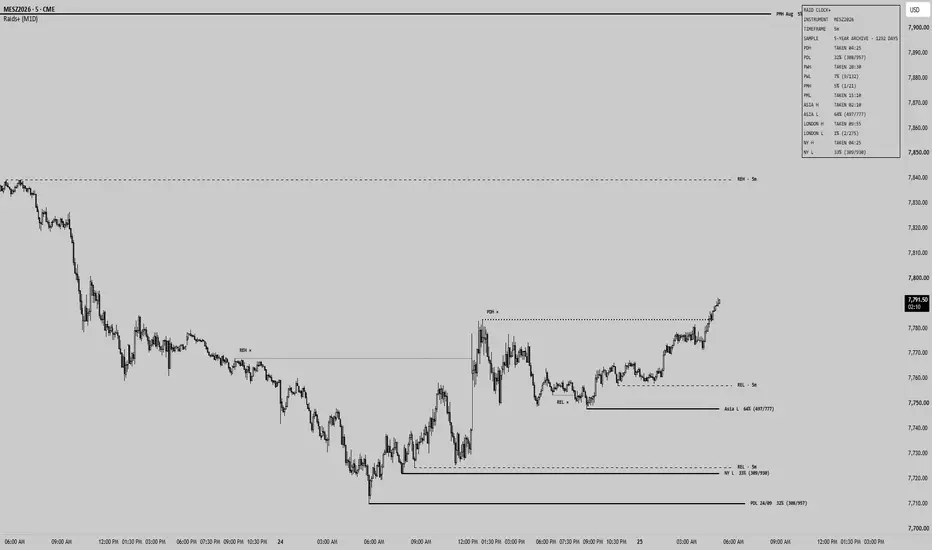
Raid Clock+
Measures the New York time of day at which twelve liquidity pools are first traded through, and reads that history back as a conditional rather than a single hit rate. A pool taken on seven days in ten is not a seven-in-ten proposition at half past nine: by then the overnight raids have already spent themselves, and what is left is a smaller, later population. It also draws the higher timeframe liquidity those pools sit in. The pools, and reading liquidity against a clock, follow ICT (Michael J. Huddleston) convention; every figure the script prints is a count, and the conditional is arithmetic applied to those counts, not something drawn from ICT teaching.
What it does
1 · The pools.
Twelve, in six pairs: the previous day's, week's and month's high and low, and the high and low of the Asia, London and New York sessions. The day, week and month are built from the chart's own candles, so a data provider's session boundary cannot change the level. Where the chart does not hold the whole period, usually the month on a one-minute chart, the level is read off the period's own candle, drawn, and kept out of the counts. A session pool is set when its window closes, the week at the weekly open, the month at the first evening open of the new month, and the day at the evening open.
2 · The statistical day.
A day runs 18:00 to 18:00 New York and is named for the regular session date it contains, so Sunday evening belongs to Monday. The previous day's high therefore exists from the evening session on, and a print through it in the evening counts as a raid in the evening window. Friday runs into Sunday as one rollover; no day is invented for a closed market.
3 · The count.
While a pool is live it is tested on every closed candle. A wick through the level is the raid by default, a close through it is available. The first raid records its thirty-minute slot and whether the candle closed back inside. Nothing reaches the history until a cycle has ended: counting the cycle still running would report a rate below the truth every time. The slot counts, the window counts and the raid count must reconcile, and the panel says so if they ever do not.
4 · The conditional.
Given a pool is still unswept at the time on the clock now, the conditional is the share of comparable past cycles that went on to take it before their own cycle ended. Cycles already raided earlier in the day are removed from both sides of the question. At the moment a pool is set the conditional equals the headline rate; from there the two separate as the day runs.
5 · The five-year archive.
On NQ and MNQ, ES and MES, GC and MGC the counts were measured once per product on five years of one-minute data, about 1,290 statistical days each, and are carried in the script, so they do not depend on how much history the chart loads. Cycles finishing after the archive are added on top. A cycle whose level was set on one quarterly contract and tested on the next is left out, since the price step between contracts is not a raid. The month is the exception: it crosses a roll about two times in three, so its level is moved by the spread between the two contracts on the last minute both traded, and the cycle is kept. The month holds 58 complete cycles, a thinner sample than the day or the week. Other symbols, session windows or a close-through raid fall back to the loaded history, and the panel says so.
6 · The liquidity levels.
The previous day, week, month and quarter highs and lows, and relative equal highs and lows (two swing pivots within a few ticks of one another), each drawn from the candle that formed them to a fixed point right of price. The quarter and the equal highs and lows are drawn but not timed: five years hold about twenty quarters, and a pool of equal highs or lows has no cycle to time. A level stays drawn however far price travels until it is taken. Day, week and equal highs and lows are on by default; month and quarter are one switch each.
7 · The panel.
The instrument, the timeframe and the sample the rates come from, then one row per timed pool: the same live conditional its line carries on the chart, with the counts behind it, or the time it was taken. Hovering a row gives the price, the rate across all cycles and whether the line has been removed. The long setting adds one chosen pool broken out across seven windows of the day and how often the raid candle closed back inside, with the Monday to Friday split on hover.
Visual grammar
Every name is a transparent callout in the pool's colour, black by default, with buyside and sellside colours as settings. A live level's name sits at its right end with the date and its live conditional, for example PDH 22/09 42%; each family ends a few bars further right than the one below, so the names settle into columns. Where two levels share a price, or a session pool sits on a drawn level, one label carries both names, one line each. A taken level turns dotted, stops at the candle that took it, and its name moves to the swing that made it, above a high or below a low, with a cross. Session pools draw as lines to the current candle or as tags at their session's right edge; a taken session pool is removed, and one left far from price or long untouched is removed with its reason on the panel's hover. Every coordinate is a timestamp, so nothing drifts off its candle.
Method & repainting
Raids are recorded on confirmed candles only and no completed cycle is ever revised. Higher timeframe values are read from the previous closed period. All times resolve through the New York clock, so the grid holds across daylight saving on any symbol. The grid is thirty minutes wide, so the script needs a 30-minute chart or finer and says so on a coarser one. A session pool set on a Friday close outlives one turn of the clock; its rate is marked with a star rather than presented straight.
Settings
The day, week, month, quarter and equal highs and lows switches, what a taken level does, the swing strength, tick tolerance and how many equal highs and lows to keep, how far right the levels reach and the gap between families; each session pair and the focus pool; the Asia, London and New York windows; wick or close as the raid, the trusted minimum, the daily range length and the archive switch; the session retirement distance and hours; the panel mode, placement and text size, and how much each caption carries; the two colours, line width, label size and caption spacing. Seventeen alerts: the raid of each timed pool and of the previous quarter's high and low, equal highs taken, equal lows taken, and a pool still unswept entering its busiest window.
Disclaimer
This is a measurement tool. It counts what a chart already contains and produces no entries, targets or stops. It is not financial advice, and no market's past behaviour is indicative of future results.
Measures the New York time of day at which twelve liquidity pools are first traded through, and reads that history back as a conditional rather than a single hit rate. A pool taken on seven days in ten is not a seven-in-ten proposition at half past nine: by then the overnight raids have already spent themselves, and what is left is a smaller, later population. It also draws the higher timeframe liquidity those pools sit in. The pools, and reading liquidity against a clock, follow ICT (Michael J. Huddleston) convention; every figure the script prints is a count, and the conditional is arithmetic applied to those counts, not something drawn from ICT teaching.
What it does
1 · The pools.
Twelve, in six pairs: the previous day's, week's and month's high and low, and the high and low of the Asia, London and New York sessions. The day, week and month are built from the chart's own candles, so a data provider's session boundary cannot change the level. Where the chart does not hold the whole period, usually the month on a one-minute chart, the level is read off the period's own candle, drawn, and kept out of the counts. A session pool is set when its window closes, the week at the weekly open, the month at the first evening open of the new month, and the day at the evening open.
2 · The statistical day.
A day runs 18:00 to 18:00 New York and is named for the regular session date it contains, so Sunday evening belongs to Monday. The previous day's high therefore exists from the evening session on, and a print through it in the evening counts as a raid in the evening window. Friday runs into Sunday as one rollover; no day is invented for a closed market.
3 · The count.
While a pool is live it is tested on every closed candle. A wick through the level is the raid by default, a close through it is available. The first raid records its thirty-minute slot and whether the candle closed back inside. Nothing reaches the history until a cycle has ended: counting the cycle still running would report a rate below the truth every time. The slot counts, the window counts and the raid count must reconcile, and the panel says so if they ever do not.
4 · The conditional.
Given a pool is still unswept at the time on the clock now, the conditional is the share of comparable past cycles that went on to take it before their own cycle ended. Cycles already raided earlier in the day are removed from both sides of the question. At the moment a pool is set the conditional equals the headline rate; from there the two separate as the day runs.
5 · The five-year archive.
On NQ and MNQ, ES and MES, GC and MGC the counts were measured once per product on five years of one-minute data, about 1,290 statistical days each, and are carried in the script, so they do not depend on how much history the chart loads. Cycles finishing after the archive are added on top. A cycle whose level was set on one quarterly contract and tested on the next is left out, since the price step between contracts is not a raid. The month is the exception: it crosses a roll about two times in three, so its level is moved by the spread between the two contracts on the last minute both traded, and the cycle is kept. The month holds 58 complete cycles, a thinner sample than the day or the week. Other symbols, session windows or a close-through raid fall back to the loaded history, and the panel says so.
6 · The liquidity levels.
The previous day, week, month and quarter highs and lows, and relative equal highs and lows (two swing pivots within a few ticks of one another), each drawn from the candle that formed them to a fixed point right of price. The quarter and the equal highs and lows are drawn but not timed: five years hold about twenty quarters, and a pool of equal highs or lows has no cycle to time. A level stays drawn however far price travels until it is taken. Day, week and equal highs and lows are on by default; month and quarter are one switch each.
7 · The panel.
The instrument, the timeframe and the sample the rates come from, then one row per timed pool: the same live conditional its line carries on the chart, with the counts behind it, or the time it was taken. Hovering a row gives the price, the rate across all cycles and whether the line has been removed. The long setting adds one chosen pool broken out across seven windows of the day and how often the raid candle closed back inside, with the Monday to Friday split on hover.
Visual grammar
Every name is a transparent callout in the pool's colour, black by default, with buyside and sellside colours as settings. A live level's name sits at its right end with the date and its live conditional, for example PDH 22/09 42%; each family ends a few bars further right than the one below, so the names settle into columns. Where two levels share a price, or a session pool sits on a drawn level, one label carries both names, one line each. A taken level turns dotted, stops at the candle that took it, and its name moves to the swing that made it, above a high or below a low, with a cross. Session pools draw as lines to the current candle or as tags at their session's right edge; a taken session pool is removed, and one left far from price or long untouched is removed with its reason on the panel's hover. Every coordinate is a timestamp, so nothing drifts off its candle.
Method & repainting
Raids are recorded on confirmed candles only and no completed cycle is ever revised. Higher timeframe values are read from the previous closed period. All times resolve through the New York clock, so the grid holds across daylight saving on any symbol. The grid is thirty minutes wide, so the script needs a 30-minute chart or finer and says so on a coarser one. A session pool set on a Friday close outlives one turn of the clock; its rate is marked with a star rather than presented straight.
Settings
The day, week, month, quarter and equal highs and lows switches, what a taken level does, the swing strength, tick tolerance and how many equal highs and lows to keep, how far right the levels reach and the gap between families; each session pair and the focus pool; the Asia, London and New York windows; wick or close as the raid, the trusted minimum, the daily range length and the archive switch; the session retirement distance and hours; the panel mode, placement and text size, and how much each caption carries; the two colours, line width, label size and caption spacing. Seventeen alerts: the raid of each timed pool and of the previous quarter's high and low, equal highs taken, equal lows taken, and a pool still unswept entering its busiest window.
Disclaimer
This is a measurement tool. It counts what a chart already contains and produces no entries, targets or stops. It is not financial advice, and no market's past behaviour is indicative of future results.
Script de código abierto
Fiel al espíritu de TradingView, el creador de este script lo ha convertido en código abierto, para que los traders puedan revisar y verificar su funcionalidad. ¡Enhorabuena al autor! Aunque puede utilizarlo de forma gratuita, recuerde que cualquier republicación del código está sujeta a nuestras Normas internas.

Exención de responsabilidad
La información y las publicaciones no constituyen, ni deben considerarse como, asesoramiento o recomendaciones financieras, de inversión, de trading u otro tipo, proporcionadas o respaldadas por TradingView. Obtenga más información en Condiciones de uso.
Script de código abierto
Fiel al espíritu de TradingView, el creador de este script lo ha convertido en código abierto, para que los traders puedan revisar y verificar su funcionalidad. ¡Enhorabuena al autor! Aunque puede utilizarlo de forma gratuita, recuerde que cualquier republicación del código está sujeta a nuestras Normas internas.
Exención de responsabilidad
La información y las publicaciones no constituyen, ni deben considerarse como, asesoramiento o recomendaciones financieras, de inversión, de trading u otro tipo, proporcionadas o respaldadas por TradingView. Obtenga más información en Condiciones de uso.