OPEN-SOURCE SCRIPT
Candle Pattern Winrate Stats
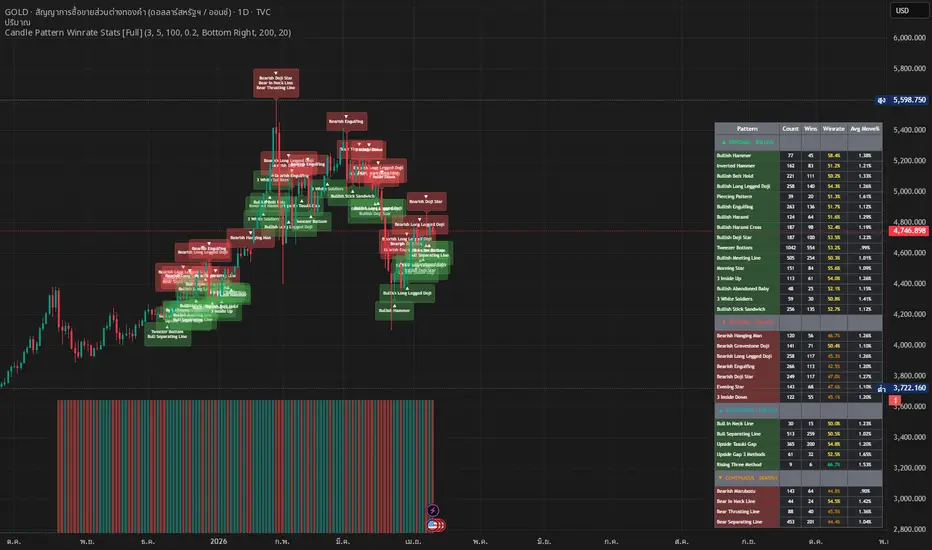
## 📊 Candle Pattern Winrate Stats [Full]
This indicator is designed to transform candlestick patterns from subjective, belief-based signals into objective, data-driven statistics.
It automatically evaluates the historical performance (winrate) of multiple candlestick patterns directly on your chart.
---
## 🔍 Core Concept
Instead of assuming that a pattern works, this script answers a more important question:
"Does this pattern actually have a statistical edge?"
The indicator:
- Detects predefined candlestick patterns (e.g., Hammer, Doji, Engulfing)
- Records each occurrence as a discrete event
- Evaluates price movement after a fixed number of candles (lookforward window)
- Classifies outcomes as Win or Loss
- Aggregates results into a measurable winrate
This allows traders to move from visual interpretation → to empirical validation.
---
## ⚙️ How It Works
### 1. Pattern Detection
Supports multiple pattern categories:
- Bullish Reversal (1 / 2 / 3 candles)
- Bearish Reversal
- Shadow-based patterns (Hammer, Shooting Star)
- Neutral patterns (Doji, Spinning Top)
Each pattern can be enabled or disabled independently.
---
### 2. Winrate Calculation Logic
For every detected pattern:
- A forward window (X candles) is defined
- Price movement is evaluated after that window
- If price moves in the expected direction → Win
- Otherwise → Loss
All results are stored and continuously updated to reflect real historical performance.
---
### 3. Filtering (Noise Reduction)
Optional filters improve signal quality:
- EMA Trend Filter
Restricts signals based on trend direction (e.g., bullish patterns only above EMA)
- Volume Filter
Filters out low-volume conditions using a moving average of volume
These filters help isolate higher-quality statistical samples.
---
### 4. Statistical Controls
- Min Samples
Displays only patterns with sufficient sample size to avoid unreliable conclusions
- Percentile Lookback
Normalizes performance relative to recent market conditions
- Tolerance (%)
Defines acceptable similarity between price values (e.g., open ≈ close)
---
## 🔬 Methodology & Statistical Framework
This script treats each candlestick pattern as a discrete statistical event rather than a visual signal.
For every detected pattern:
- A fixed forward return horizon is applied (lookforward window)
- Outcomes are simplified into binary classification (win / loss)
- Empirical probabilities are derived from aggregated historical samples
Unlike traditional candlestick indicators, this approach enables:
- Objective measurement of pattern performance
- Direct comparison across different pattern types
- Reduction of subjective bias in decision-making
---
## 📋 Output
- Winrate (%) for each pattern
- Number of samples (data reliability)
- On-chart summary table (customizable position)
---
## 🧠 Professional Usage
❌ Avoid:
- Using patterns as direct entry signals
✅ Recommended:
- Use winrate as a filtering tool
- Focus on statistically significant patterns
- Combine with:
- Market Structure
- Supply / Demand
- Trend context
---
## 📊 Example Interpretation
Pattern | Winrate | Sample | Insight
---|---|---|---
Hammer | 62% | 120 | Usable
Doji | 48% | 300 | No statistical edge
Engulfing | 68% | 80 | Strong signal
---
## ⚠️ Important Notes
- Winrate ≠ Profit (risk/reward must be considered)
- Market conditions evolve → statistics may change over time
- Results vary across different timeframes and assets
- Be cautious of overfitting when sample size is small
---
## 🎯 Who Is This For
- System traders
- Quantitative / data-driven traders
- Developers building trading bots (MQL5, Pine Script, Python)
- Traders seeking objective validation over subjective analysis
---
## 🚀 Key Insight
"Does this pattern actually work — or does it just look like it does?"
This indicator is designed to transform candlestick patterns from subjective, belief-based signals into objective, data-driven statistics.
It automatically evaluates the historical performance (winrate) of multiple candlestick patterns directly on your chart.
---
## 🔍 Core Concept
Instead of assuming that a pattern works, this script answers a more important question:
"Does this pattern actually have a statistical edge?"
The indicator:
- Detects predefined candlestick patterns (e.g., Hammer, Doji, Engulfing)
- Records each occurrence as a discrete event
- Evaluates price movement after a fixed number of candles (lookforward window)
- Classifies outcomes as Win or Loss
- Aggregates results into a measurable winrate
This allows traders to move from visual interpretation → to empirical validation.
---
## ⚙️ How It Works
### 1. Pattern Detection
Supports multiple pattern categories:
- Bullish Reversal (1 / 2 / 3 candles)
- Bearish Reversal
- Shadow-based patterns (Hammer, Shooting Star)
- Neutral patterns (Doji, Spinning Top)
Each pattern can be enabled or disabled independently.
---
### 2. Winrate Calculation Logic
For every detected pattern:
- A forward window (X candles) is defined
- Price movement is evaluated after that window
- If price moves in the expected direction → Win
- Otherwise → Loss
All results are stored and continuously updated to reflect real historical performance.
---
### 3. Filtering (Noise Reduction)
Optional filters improve signal quality:
- EMA Trend Filter
Restricts signals based on trend direction (e.g., bullish patterns only above EMA)
- Volume Filter
Filters out low-volume conditions using a moving average of volume
These filters help isolate higher-quality statistical samples.
---
### 4. Statistical Controls
- Min Samples
Displays only patterns with sufficient sample size to avoid unreliable conclusions
- Percentile Lookback
Normalizes performance relative to recent market conditions
- Tolerance (%)
Defines acceptable similarity between price values (e.g., open ≈ close)
---
## 🔬 Methodology & Statistical Framework
This script treats each candlestick pattern as a discrete statistical event rather than a visual signal.
For every detected pattern:
- A fixed forward return horizon is applied (lookforward window)
- Outcomes are simplified into binary classification (win / loss)
- Empirical probabilities are derived from aggregated historical samples
Unlike traditional candlestick indicators, this approach enables:
- Objective measurement of pattern performance
- Direct comparison across different pattern types
- Reduction of subjective bias in decision-making
---
## 📋 Output
- Winrate (%) for each pattern
- Number of samples (data reliability)
- On-chart summary table (customizable position)
---
## 🧠 Professional Usage
❌ Avoid:
- Using patterns as direct entry signals
✅ Recommended:
- Use winrate as a filtering tool
- Focus on statistically significant patterns
- Combine with:
- Market Structure
- Supply / Demand
- Trend context
---
## 📊 Example Interpretation
Pattern | Winrate | Sample | Insight
---|---|---|---
Hammer | 62% | 120 | Usable
Doji | 48% | 300 | No statistical edge
Engulfing | 68% | 80 | Strong signal
---
## ⚠️ Important Notes
- Winrate ≠ Profit (risk/reward must be considered)
- Market conditions evolve → statistics may change over time
- Results vary across different timeframes and assets
- Be cautious of overfitting when sample size is small
---
## 🎯 Who Is This For
- System traders
- Quantitative / data-driven traders
- Developers building trading bots (MQL5, Pine Script, Python)
- Traders seeking objective validation over subjective analysis
---
## 🚀 Key Insight
"Does this pattern actually work — or does it just look like it does?"
Script de código abierto
Fiel al espíritu de TradingView, el creador de este script lo ha convertido en código abierto, para que los traders puedan revisar y verificar su funcionalidad. ¡Enhorabuena al autor! Aunque puede utilizarlo de forma gratuita, recuerde que cualquier republicación del código está sujeta a nuestras Normas internas.

Exención de responsabilidad
La información y las publicaciones no constituyen, ni deben considerarse como, asesoramiento o recomendaciones financieras, de inversión, de trading u otro tipo, proporcionadas o respaldadas por TradingView. Obtenga más información en Condiciones de uso.
Script de código abierto
Fiel al espíritu de TradingView, el creador de este script lo ha convertido en código abierto, para que los traders puedan revisar y verificar su funcionalidad. ¡Enhorabuena al autor! Aunque puede utilizarlo de forma gratuita, recuerde que cualquier republicación del código está sujeta a nuestras Normas internas.
Exención de responsabilidad
La información y las publicaciones no constituyen, ni deben considerarse como, asesoramiento o recomendaciones financieras, de inversión, de trading u otro tipo, proporcionadas o respaldadas por TradingView. Obtenga más información en Condiciones de uso.