OPEN-SOURCE SCRIPT
Volumetric Regression Heatmap [LuxAlgo]
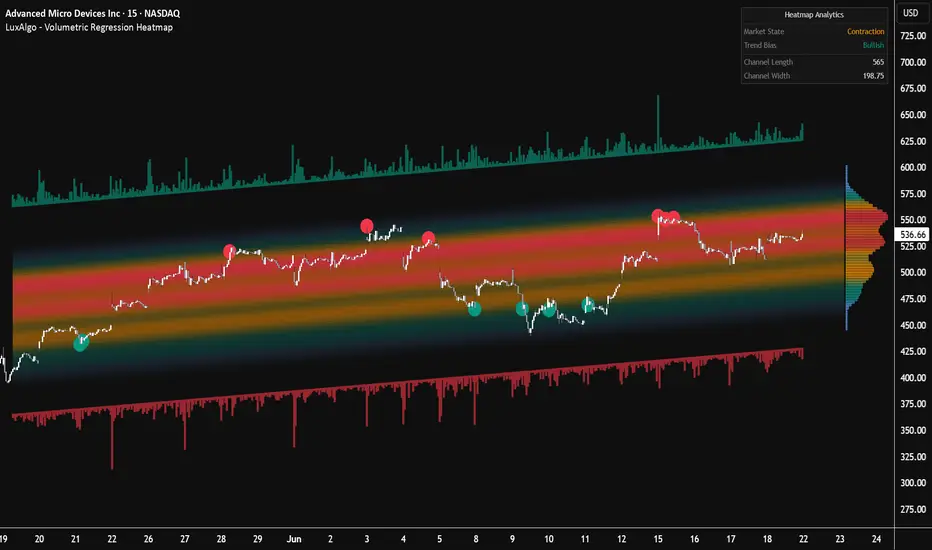
The Volumetric Regression Heatmap indicator is a sophisticated market analysis tool that combines dynamic linear regression with volume profile density to visualize fair value and liquidity zones. By projecting volume-weighted heatmaps within a trend-following channel, it allows traders to identify where the bulk of trading activity has occurred relative to the current price trajectory.
🔶 USAGE
The indicator provides a multi-layered view of market structure. The central heatmap shows the "hottest" areas of volume concentration, acting as a magnet for price, while the outer bands represent statistical extremes.
🔹 Mean Reversion Signals
The script includes a built-in signal system designed for sideways or "flat" markets. When the indicator detects a "Contraction" state (determined by the ratio of channel height to standard deviation), it plots small circles at the +2/-2 standard deviation levels.
🔹 Future Projections & Profile
The heatmap extends beyond the current bar, providing a "Future Projection" zone. This allows traders to anticipate where support and resistance levels will be in the coming sessions. To the right of the projection, a Bookmap-style volume profile histogram displays the total volume distribution, helping to identify high-volume nodes (HVN) and low-volume nodes (LVN) at a glance.
🔶 DETAILS
🔹 Dynamic Auto-Adjusting Period
Unlike standard regression channels that use a fixed lookback, this tool features an adaptive engine. It calculates the ratio between short-term and long-term volatility (ATR).
🔹 Volumetric Delta Histograms
The script calculates the approximate buying and selling volume for every candle within the lookback period. This data is visualized as histograms extending from the outer bands:
This allows traders to see not just where price is, but the intensity of the volume driving it toward the channel extremes.
🔶 SETTINGS
🔹 Core Settings
🔹 Heatmap Settings
🔹 Mean Reversion Signals
🔹 Delta Histograms
🔹 Style & Options
🔹 Dashboard
🔶 USAGE
The indicator provides a multi-layered view of market structure. The central heatmap shows the "hottest" areas of volume concentration, acting as a magnet for price, while the outer bands represent statistical extremes.
🔹 Mean Reversion Signals
The script includes a built-in signal system designed for sideways or "flat" markets. When the indicator detects a "Contraction" state (determined by the ratio of channel height to standard deviation), it plots small circles at the +2/-2 standard deviation levels.
- Green Circles: Potential long opportunities when price crosses below the lower signal band during a flat market.
- Red Circles: Potential short opportunities when price crosses above the upper signal band during a flat market.
🔹 Future Projections & Profile
The heatmap extends beyond the current bar, providing a "Future Projection" zone. This allows traders to anticipate where support and resistance levels will be in the coming sessions. To the right of the projection, a Bookmap-style volume profile histogram displays the total volume distribution, helping to identify high-volume nodes (HVN) and low-volume nodes (LVN) at a glance.
🔶 DETAILS
🔹 Dynamic Auto-Adjusting Period
Unlike standard regression channels that use a fixed lookback, this tool features an adaptive engine. It calculates the ratio between short-term and long-term volatility (ATR).
- In high-volatility environments, the channel period shrinks to become more reactive.
- In low-volatility or ranging environments, the period expands to capture a broader structural view.
🔹 Volumetric Delta Histograms
The script calculates the approximate buying and selling volume for every candle within the lookback period. This data is visualized as histograms extending from the outer bands:
- Top Band (Green): Displays buying pressure delta.
- Bottom Band (Red): Displays selling pressure delta.
This allows traders to see not just where price is, but the intensity of the volume driving it toward the channel extremes.
🔶 SETTINGS
🔹 Core Settings
- Source: The price source used for the regression calculation.
- Base Period: The anchor length for the regression fit.
- Dynamic Auto-Adjusting Period: Enables/disables the volatility-based adaptive lookback.
🔹 Heatmap Settings
- Grid Rows Each Side: Determines the vertical resolution of the heatmap bands.
- Gradient Smoothing: Applies a smoothing algorithm to the volume distribution for a cleaner visual gradient.
- Colors 1-5: Customizable colors ranging from low-volume areas to high-volume "hot" zones.
🔹 Mean Reversion Signals
- Signal Band (SD Multiplier): The standard deviation level required to trigger a signal.
- Flat Slope Threshold: Controls how "flat" the channel must be to allow signals to appear, preventing counter-trend signals in strong trending markets.
🔹 Delta Histograms
- Histogram Height Scale: Adjusts the vertical magnitude of the delta bars.
- Histogram Bar Width: Sets the thickness of the individual delta lines.
🔹 Style & Options
- Future Projection Length: How many bars to project the heatmap into the future.
- Show Volume Profile Histogram: Toggles the right-sided volume distribution boxes.
🔹 Dashboard
- Dashboard: Toggles the on-screen analytics panel.
- Position/Size: Adjusts the location and scale of the dashboard UI.
Script de código abierto
Fiel al espíritu de TradingView, el creador de este script lo ha convertido en código abierto, para que los traders puedan revisar y verificar su funcionalidad. ¡Enhorabuena al autor! Aunque puede utilizarlo de forma gratuita, recuerde que cualquier republicación del código está sujeta a nuestras Normas internas.

Build your own edge with AI: luxalgo.com
All content provided by LuxAlgo is for informational & educational purposes only. Past performance does not guarantee future results.
All content provided by LuxAlgo is for informational & educational purposes only. Past performance does not guarantee future results.
Exención de responsabilidad
La información y las publicaciones no constituyen, ni deben considerarse como, asesoramiento o recomendaciones financieras, de inversión, de trading u otro tipo, proporcionadas o respaldadas por TradingView. Obtenga más información en Condiciones de uso.
Script de código abierto
Fiel al espíritu de TradingView, el creador de este script lo ha convertido en código abierto, para que los traders puedan revisar y verificar su funcionalidad. ¡Enhorabuena al autor! Aunque puede utilizarlo de forma gratuita, recuerde que cualquier republicación del código está sujeta a nuestras Normas internas.
Build your own edge with AI: luxalgo.com
All content provided by LuxAlgo is for informational & educational purposes only. Past performance does not guarantee future results.
All content provided by LuxAlgo is for informational & educational purposes only. Past performance does not guarantee future results.
Exención de responsabilidad
La información y las publicaciones no constituyen, ni deben considerarse como, asesoramiento o recomendaciones financieras, de inversión, de trading u otro tipo, proporcionadas o respaldadas por TradingView. Obtenga más información en Condiciones de uso.