OPEN-SOURCE SCRIPT
Ants Indicator [MVP]
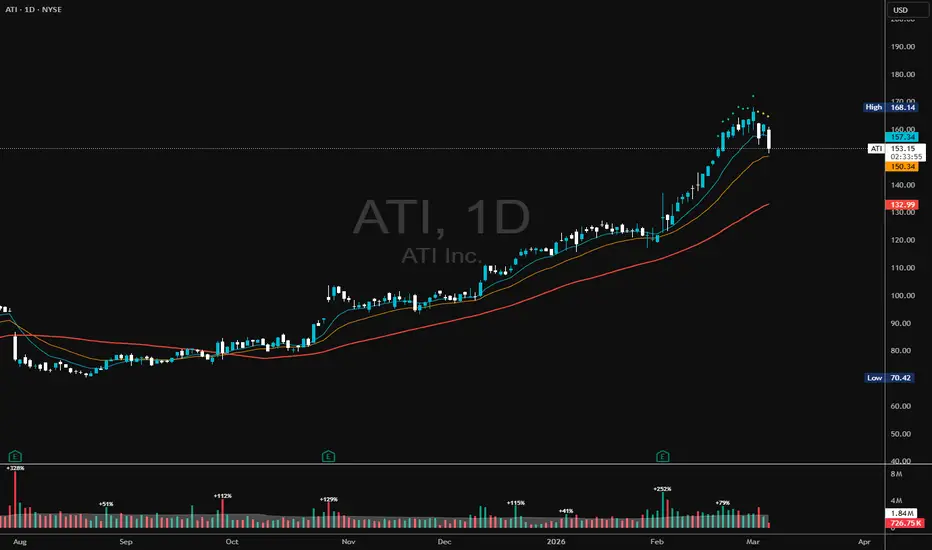
Overview This indicator is based on the research and trading concepts of David Ryan, a three-time U.S. Investing Champion and protégé of William O’Neil. The "Ants" indicator is designed to detect institutional accumulation—footprints of "smart money" entering a stock aggressively over a sustained period.
David Ryan discovered that the biggest winning stocks often showed a specific pattern before their major moves: consistent buying (volume) and price appreciation over a short window (12-15 days). This persistent buying creates the appearance of "ants" marching up the chart.
The MVP Logic (Momentum, Volume, Price) The indicator looks for the confluence of three specific criteria over a 15-day lookback period:
Momentum: The stock closed higher in at least 12 out of the last 15 days. This shows persistent demand.
Volume: The average volume over the last 15 days is at least 20-25% higher than the 50-day average volume. This confirms institutional participation.
Price: The price has increased by at least 20% over the last 15 days.
Indicator Features & Signal Colors This script visualizes these conditions using diamond markers above the bars. The colors indicate which criteria are met:
🟢 Green Ant (MVP): The Holy Grail. Momentum + Volume + Price conditions are ALL met. This represents the strongest institutional buying.
🟡 Yellow Ant: Momentum + Volume (Price increase is < 20%).
🔵 Blue Ant: Momentum + Price (Volume increase is < 20%).
⚪ Gray Ant: Momentum only (12/15 up days, but lacking volume and price explosive moves).
Advanced Features: Topping & Extension Detection While "Ants" indicate strength, they also appear when a stock is becoming extended (climax top). This script includes a Smart Tooltip.
Hover over any diamond to see detailed statistics:
Exact MVP counts (e.g., "Close Up: 13/15").
Percentage extended from the 50-day SMA.
ATR Multiple: How far price is from the 50 SMA in terms of volatility. High readings (e.g., >100% extension or high ATR multiples) can signal a potential top rather than a buy entry.
How to Use for Trading DO NOT simply buy when a green diamond appears.
Identify: Use the indicator to find stocks under heavy accumulation.
Wait: "Ants" often appear when a stock is extended. Wait for the stock to consolidate, form a High Tight Flag, or pull back to the 10 EMA or 21 EMA.
Execute: Enter on the breakout from the consolidation area that forms after the Ants appeared.
Formula & Settings
Lookback Period: 15 Days (Default)
Momentum Threshold: 12 Up days (Default)
Volume Filter: +20% vs 50-SMA Volume
Price Filter: +20% return in lookback period
Credits Concept by David Ryan. Script logic adapted for Trading View Pine Script v6.
David Ryan discovered that the biggest winning stocks often showed a specific pattern before their major moves: consistent buying (volume) and price appreciation over a short window (12-15 days). This persistent buying creates the appearance of "ants" marching up the chart.
The MVP Logic (Momentum, Volume, Price) The indicator looks for the confluence of three specific criteria over a 15-day lookback period:
Momentum: The stock closed higher in at least 12 out of the last 15 days. This shows persistent demand.
Volume: The average volume over the last 15 days is at least 20-25% higher than the 50-day average volume. This confirms institutional participation.
Price: The price has increased by at least 20% over the last 15 days.
Indicator Features & Signal Colors This script visualizes these conditions using diamond markers above the bars. The colors indicate which criteria are met:
🟢 Green Ant (MVP): The Holy Grail. Momentum + Volume + Price conditions are ALL met. This represents the strongest institutional buying.
🟡 Yellow Ant: Momentum + Volume (Price increase is < 20%).
🔵 Blue Ant: Momentum + Price (Volume increase is < 20%).
⚪ Gray Ant: Momentum only (12/15 up days, but lacking volume and price explosive moves).
Advanced Features: Topping & Extension Detection While "Ants" indicate strength, they also appear when a stock is becoming extended (climax top). This script includes a Smart Tooltip.
Hover over any diamond to see detailed statistics:
Exact MVP counts (e.g., "Close Up: 13/15").
Percentage extended from the 50-day SMA.
ATR Multiple: How far price is from the 50 SMA in terms of volatility. High readings (e.g., >100% extension or high ATR multiples) can signal a potential top rather than a buy entry.
How to Use for Trading DO NOT simply buy when a green diamond appears.
Identify: Use the indicator to find stocks under heavy accumulation.
Wait: "Ants" often appear when a stock is extended. Wait for the stock to consolidate, form a High Tight Flag, or pull back to the 10 EMA or 21 EMA.
Execute: Enter on the breakout from the consolidation area that forms after the Ants appeared.
Formula & Settings
Lookback Period: 15 Days (Default)
Momentum Threshold: 12 Up days (Default)
Volume Filter: +20% vs 50-SMA Volume
Price Filter: +20% return in lookback period
Credits Concept by David Ryan. Script logic adapted for Trading View Pine Script v6.
Script de código abierto
Fiel al espíritu de TradingView, el creador de este script lo ha convertido en código abierto, para que los traders puedan revisar y verificar su funcionalidad. ¡Enhorabuena al autor! Aunque puede utilizarlo de forma gratuita, recuerde que cualquier republicación del código está sujeta a nuestras Normas internas.

Exención de responsabilidad
La información y las publicaciones no constituyen, ni deben considerarse como, asesoramiento o recomendaciones financieras, de inversión, de trading u otro tipo, proporcionadas o respaldadas por TradingView. Obtenga más información en Condiciones de uso.
Script de código abierto
Fiel al espíritu de TradingView, el creador de este script lo ha convertido en código abierto, para que los traders puedan revisar y verificar su funcionalidad. ¡Enhorabuena al autor! Aunque puede utilizarlo de forma gratuita, recuerde que cualquier republicación del código está sujeta a nuestras Normas internas.
Exención de responsabilidad
La información y las publicaciones no constituyen, ni deben considerarse como, asesoramiento o recomendaciones financieras, de inversión, de trading u otro tipo, proporcionadas o respaldadas por TradingView. Obtenga más información en Condiciones de uso.